Widget Hackathon 2025: How a team of 6 shipped 10 interface design features in 2 days
We ran a two-day widget hackathon focused on Port’s Interface Designer (you might know this as pages, dashboards, and widgets). Six developers shipped ten features, seven of them went to production immediately.


1. TL;DR
Between end-of-year wrap-ups and holiday breaks, we ran a two-day widget hackathon focused on Port’s Interface Designer (you might know this as pages, dashboards, and widgets). Six developers shipped ten features, seven of them went to production immediately.
The work included:
- Pie chart slice drilldown
- Pie chart slice hover interaction
- Number display formatting
- Markdown widgets can pull content from Markdown entity properties
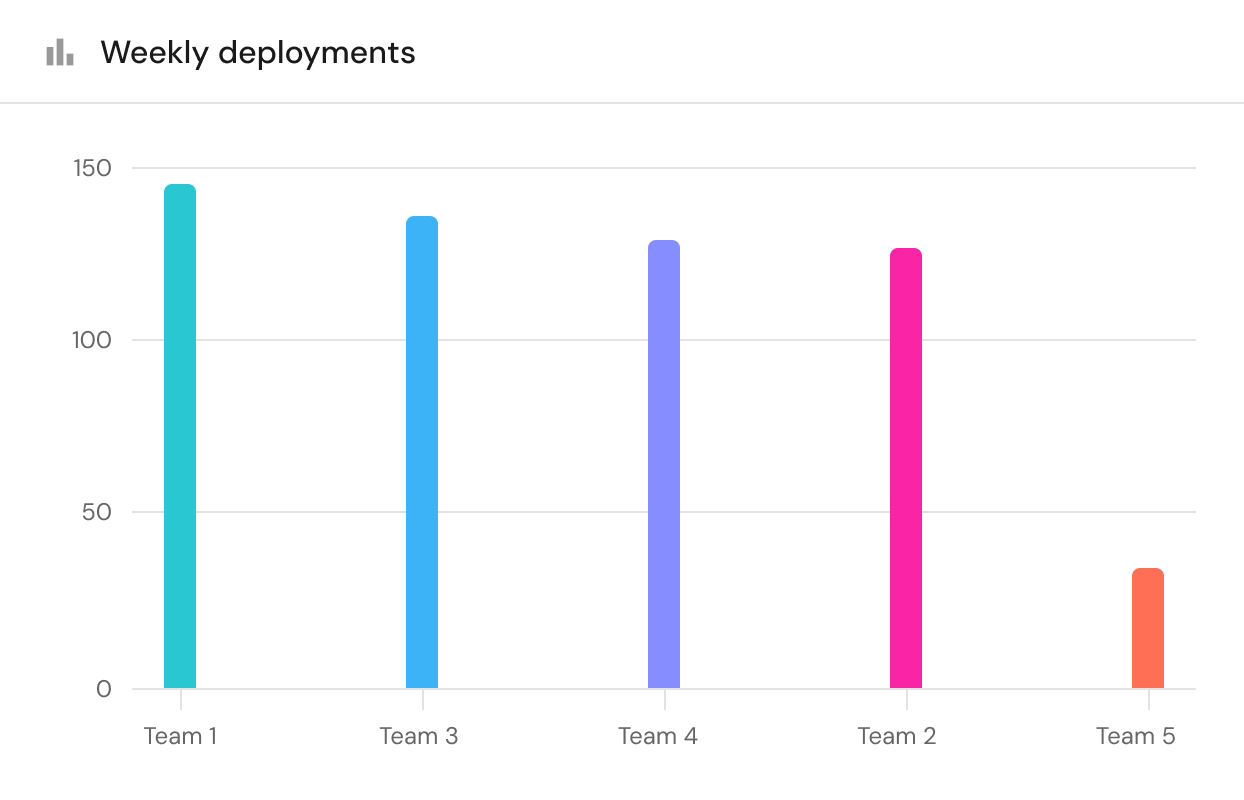
- Bar chart widget
- Inject user and entity data into an iframe and Markdown widgets
- and more.
All of these improvements make dashboards more interactive and contextual, letting teams inspect data and act on it directly. As a product practice, this format lets us turn clear feedback into shipped features in days instead of quarters, without losing focus on the bigger product work.
2. Why a hackathon and why now?
Teams use the Interface Designer as the entry point to their daily workflows, not just as a reporting or data consumption layer. It’s where platform teams bring together their services, incidents, deployments, scorecards and more catalog data into pages that match how they review their SDLC processes, track changes, and investigate issues. So when basic widget capabilities are missing, these core flows slow down considerably or teams are forced to use workarounds.
We knew that many of our customers have dashboards showing distributions of incidents or failed deployments, but when they spotted a suspicious slice they had no way to drill into it. Teams had to work around this by rebuilding filters by hand or searching manually just to see which services or runs were behind a single pie widget slice. Out of that pain came a clear Ask, captured in a 23 vote request on our public feature requests board: clicking a pie slice should open the relevant table of entities.
Users reviewing metrics also had to deal with numeric precision, or lack thereof. Values like 4.05882334 made simple comparisons harder than they needed to be. A 24 vote feature request asked for number display formatting so admins could round or customize decimals, for example, showing 4.06 instead.
Teams kept remediation steps, READMEs, and internal notes as markdown on entities, but couldn’t surface those in dashboards cleanly. A 26 vote feature request asked to pull markdown directly from entity properties.
Other requests were about missing visualization tools. Admins wanted a bar chart for category comparisons. One of our largest devops customers asked for contextual widgets that pick up user or entity information, so dashboards can adapt without duplication.
The hackathon focused on these exact gaps, and more.
At the same time, we’re committed to large, long-horizon product work like turning scorecards into blueprints. It means that smaller high-impact improvements often wait longer than they should.
A hackathon gave us exactly what we needed: 2 days of intense focus outside our usual routine to work on an area where users experience Port the most. Getting the whole team in one room (and obviously with lots of food and drinks), raised the energy level and output speed to levels we couldn’t achieve without a hackathon. The team eventually shipped more features than originally planned.
3. The key to a successful hackathon: preparation
The hackathon goal was simple: fix the small, sharp items that kept coming up from customers and from our very own teams (anyone mentioned dogfooding?).
Product preparation started with Port’s public feature request board and internal requests from GTM and our own Port usage. I filtered the widget-related items, removed anything unclear or too large, and ran a quick technical assessment to ensure each item realistically fit inside two days. I wrote the product requirements and gathered the design assets needed so development could start immediately.
We followed with a second detailed technical review to align on assumptions and close remaining gaps. GTM provided internal votes to add another layer of prioritization. Developers participated in the entire prep process. One day before the hackathon, each developer picked the item they wanted to own from the back of ready-for-development feature requests.
By the time we started, everyone knew exactly what we were solving, who requested it, and why it mattered. When the hackathon started, people could simply open their laptop, pull an item, develop and then ship smoothly.
As a product manager, I’ve found this format works really (really) well. It turns clear feedback into shipped features in days instead of quarters, and the upfront preparation is what actually makes that possible. It also increases ownership: developers are involved early, choose what to build, and see it land in production, which drives their engagement and a strong sense of achievement.
4. Using the new features (a few examples)
Use case 1: Explore incidents directly from charts
Who: Platform engineers
Situation: A dashboard shows a pie chart of failed deployments or incidents by service or owning team. One slice looks like a black box and teams asked for a way to drill into it.
How it works: The engineer clicks the slice. A table opens with the entities behind it, already filtered.
Outcome: They move from a top-level signal to the exact services or runs behind it, without rebuilding queries or switching screens.
Use case 2: Take action with guidance in the right place
Who: Platform engineers
Situation: An alert or service stores markdown with remediation steps or runbook notes, but the team wants to see that guidance right next to the live data.
How it works: A markdown widget pulls the content directly from an entity’s markdown property, displayed on that entity’s page.
Outcome: The engineer reviews the issue and the steps in one view, with no tab switching and no duplicated text.
Use case 3: Compare key Engineering Intelligence metrics in one chart
Who: Engineering leaders
Situation: A manager wants to review deployment frequency, MTTR, and AI Copilot usage over time in one place to understand impact on the SDLC.
How it works: They configure a multi-metric line chart (planned) and set three lines on the same graph, one for each metric, all sharing the same x-axis.
Outcome: It becomes easy to compare trends and correlations without jumping between separate charts or tools.
5. How to use it? (3 examples out of 10)
GIF 1: Markdown widget that surfaces an entity and user properties
- In the catalog, go to a specific entity page of a service
- Add a Markdown widget
- Choose “property” as the source
- Select a markdown property such as README
- The widget surfaces the content dynamically for each entity
.gif)
GIF 2: Pie chart slice on hover (%) and drilldown
- Open a page with a pie chart widget
- Hover a slice to show its percentage
- Click the slice
- A popup table appears with the entities that make up that slice
.gif)
Hackathon moments, in photos:


Get your survey template today
Download your survey template today


Free Roadmap planner for Platform Engineering teams
Set Clear Goals for Your Portal
Define Features and Milestones
Stay Aligned and Keep Moving Forward
Create your Roadmap


Free RFP template for Internal Developer Portal
Creating an RFP for an internal developer portal doesn’t have to be complex. Our template gives you a streamlined path to start strong and ensure you’re covering all the key details.
Get the RFP template


Leverage AI to generate optimized JQ commands
test them in real-time, and refine your approach instantly. This powerful tool lets you experiment, troubleshoot, and fine-tune your queries—taking your development workflow to the next level.
Explore now
Check out Port's pre-populated demo and see what it's all about.
No email required
.png)
Check out the 2025 State of Internal Developer Portals report
No email required
Minimize engineering chaos. Port serves as one central platform for all your needs.
Act on every part of your SDLC in Port.
Your team needs the right info at the right time. With Port's software catalog, they'll have it.
Learn more about Port's agentic engineering platform
Read the launch blog
Contact sales for a technical walkthrough of Port
Every team is different. Port lets you design a developer experience that truly fits your org.
As your org grows, so does complexity. Port scales your catalog, orchestration, and workflows seamlessly.
Port × n8n Boost AI Workflows with Context, Guardrails, and Control
Port Builders Session: A Single, Governed Interface for All MCP Servers
Book a demo right now to check out Port's developer portal yourself
Apply to join the Beta for Port's new Backstage plugin


n8n + Port templates you can use today
walkthrough of ready-to-use workflows you can clone