How we would have managed a recent incident at Port with an incident agent
We had a real incident where three teams investigated the same problem in parallel. Here's what happened, what we built to make sure it doesn't happen again, and how we're using Port to move toward autonomous incident resolution.

.png)
A couple of weeks ago we had an incident. Three different teams got paged, each one investigated separately, and it took some time to figure out they were all looking at the same problem.
We went through the Slack threads afterward and mapped out what happened. Then we got together as a team and asked: what would this have looked like if an agent handled the incident end-to-end?
This article is that exercise. The real incident, what went wrong in how we responded, and what we're building to make sure it goes differently next time.
The incident
On a Friday evening, a customer created 1.7 million automation runs in 90 minutes. Kafka offset lag spiked across multiple services.
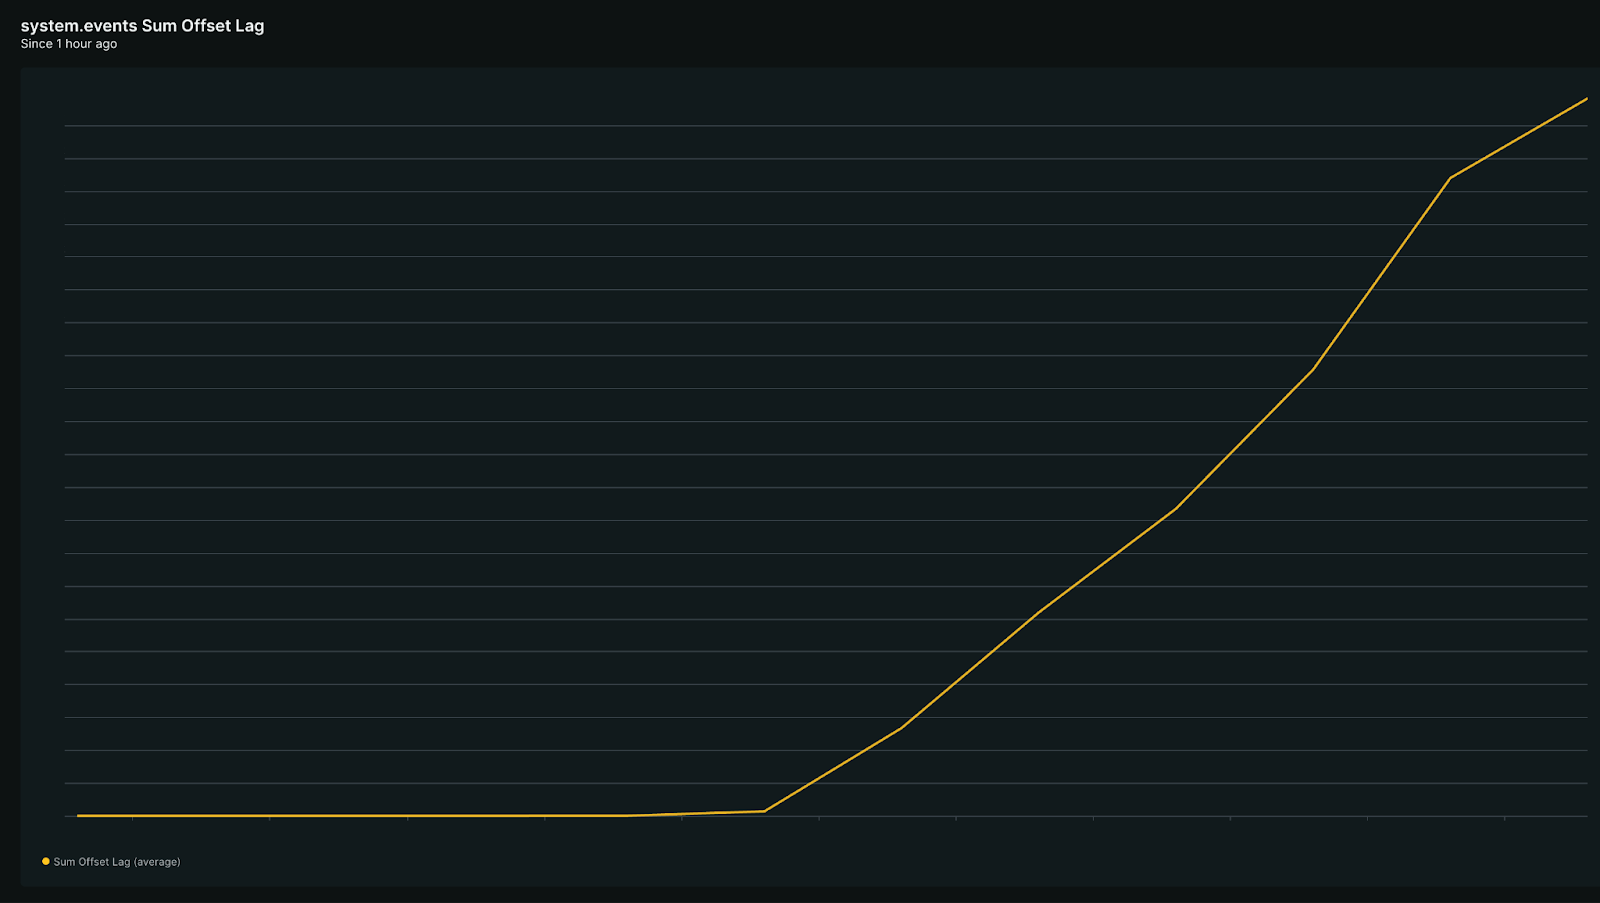
PagerDuty fired alerts for three of our teams: Actions, Spotlight, and Builder. Three on-call engineers acknowledged in three separate Slack channels without knowing about each other.
The Actions team found the offset lag first. Their on-call engineer restarted the service worker through a self-service action in Port. It didn't help. So he then dug into our automation run counts, narrowed the spike to three orgs, traced them all back to one customer. After that, he tried to scale out, but the config override action didn't exist in Port for this service. So he opened a manual PR, waited for DevOps approval, and hit a failing Argo diff that needed a third person.
Another team called Builder also got a PagerDuty alert at the same time, but started talking about it in a different Slack thread. Their engineer also restarted workers. Also checked New Relic. Also checked Kafka UI. And got the same false hope: "lag seems to decrease as restart rolls out." It didn't.
43 minutes in, someone from a 3rd team Spotlight, while dealing with the same incident on their own, finally asked: "do you think our alert is related?" That was the first time anyone connected the dots. Three teams had been investigating the same root cause in parallel, trying the same restart that didn't work, wasting the same ten minutes twice.
By the time the threads merged, 77 minutes had passed. The remediation plan was two words: scale out. Getting there took over an hour of human coordination across three Slack threads, New Relic, Kafka UI, PagerDuty, GitHub, and Argo.
But we're working on something big to resolve incidents in record time.
Our first step: A triage agent
We're building toward an agent that handles the full incident lifecycle. But the first piece is already live: an agent that triages the incident in Port and posts a message to on-call engineers in Slack within minutes.
Two things make it work:
The Context Lake
The Port Context Lake gives the agent everything it needs to know about how our SDLC behaves. It holds everything about our micro-services, deployment history, CI/CD jobs, ownership, dependencies, vulnerabilities, team structure, and much more. When the agent finds a failing service, it already knows who owns it, what recently deployed, what other services depend on it, and which customers are affected because everything in Port is connected.
During the Kafka incident, an engineer spent time tracing three org IDs back to one customer. The context lake already has those relationships. The agent would have just read them instead of piecing them together between different tools.
The Context Lake also gives you granular control over what data the agent can access, scoped by team, service, or any parameter you want, so an agent triaging a billing incident doesn't see unrelated PII. This keeps the context window small: less noise means less hallucination, and the agent gets exactly what it needs to investigate this incident, and nothing more.
The triage skill file
The triage skill file tells the agent what to do with that knowledge it finds in the Context Lake. It's our incident playbook written down for an agent. In other words, it's how WE investigate.
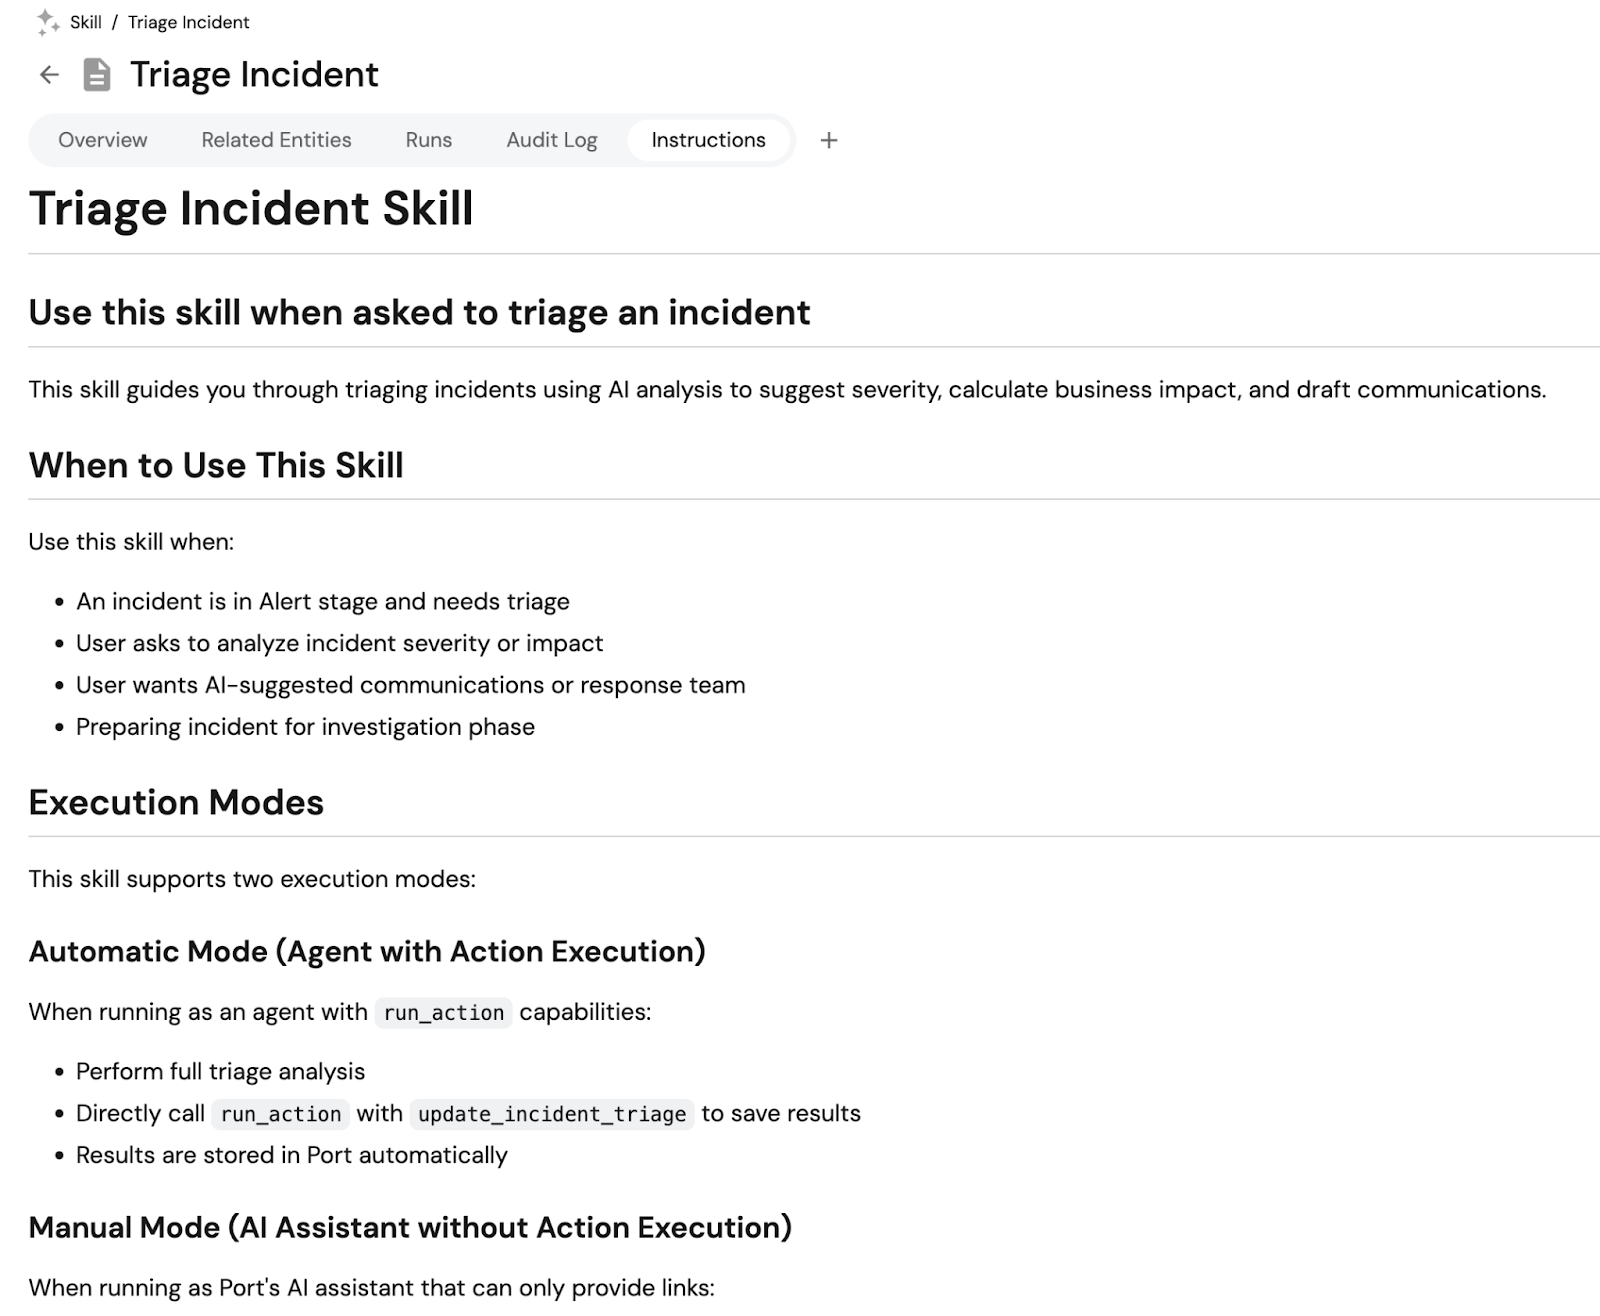
Equipped with those two things, here's what the triage agent does:
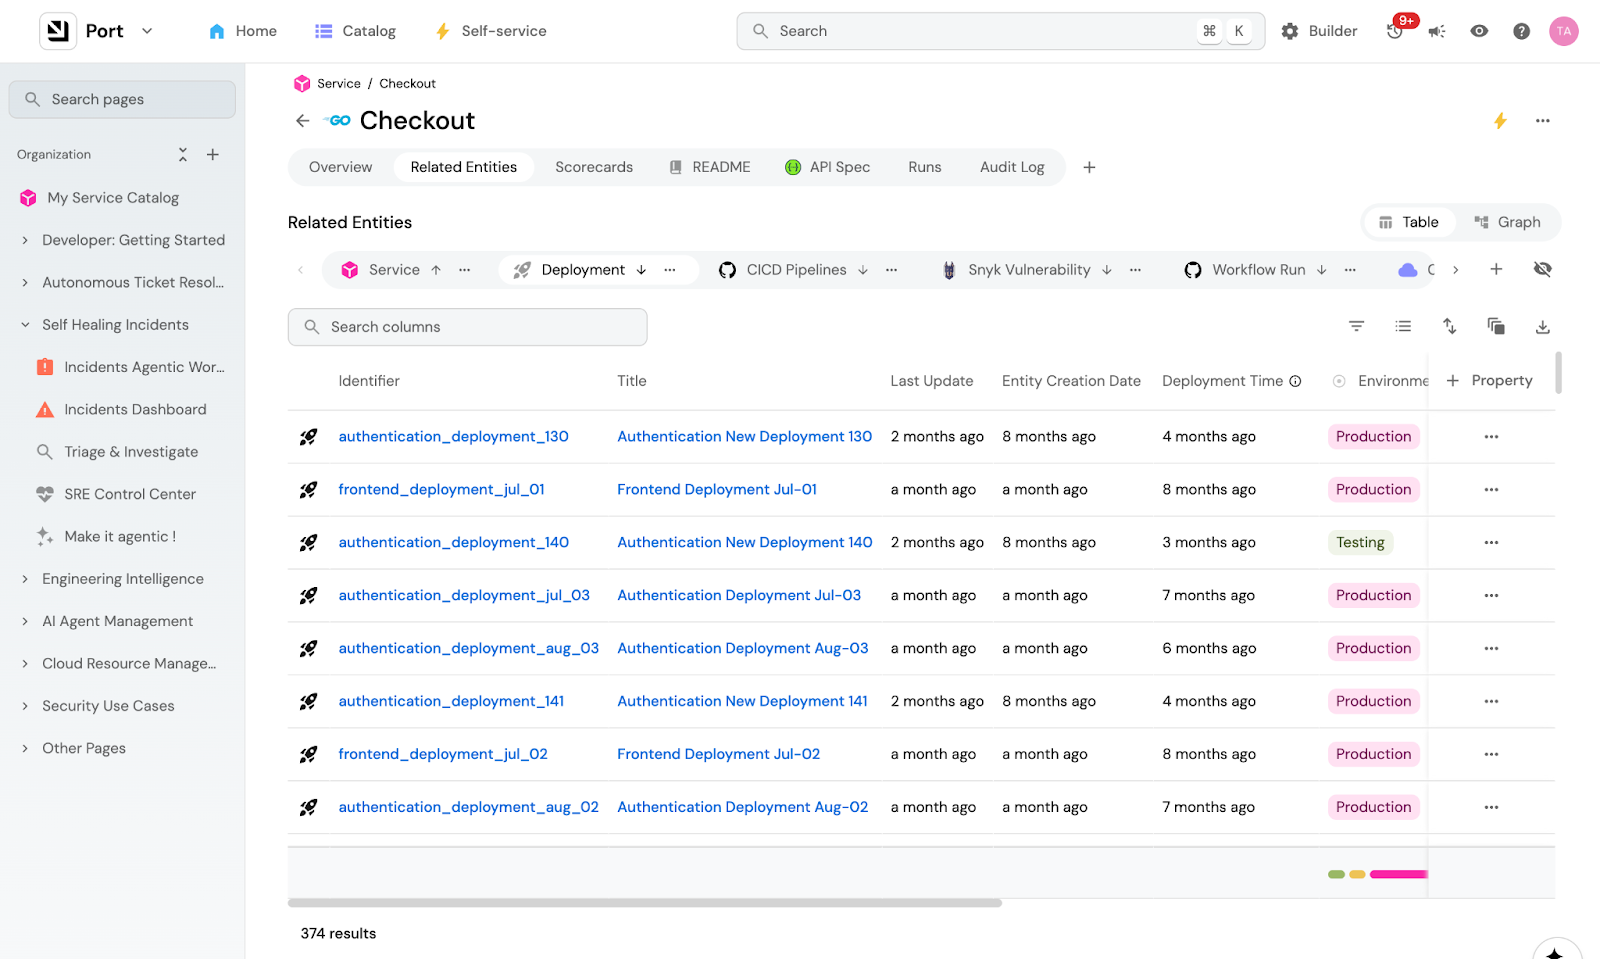
1. Pulls incident details from the Context Lake. A new incident triggers the workflow. The agent gets the service, region, timestamp, ownership, dependencies, recent deployments, and recent PRs.
2. Assesses severity and blast radius. The agent checks which services depend on the affected one, who owns them, and what the current SLO status is. During the Kafka incident, an engineer manually traced three org IDs back to one customer. The context lake already has those relationships.
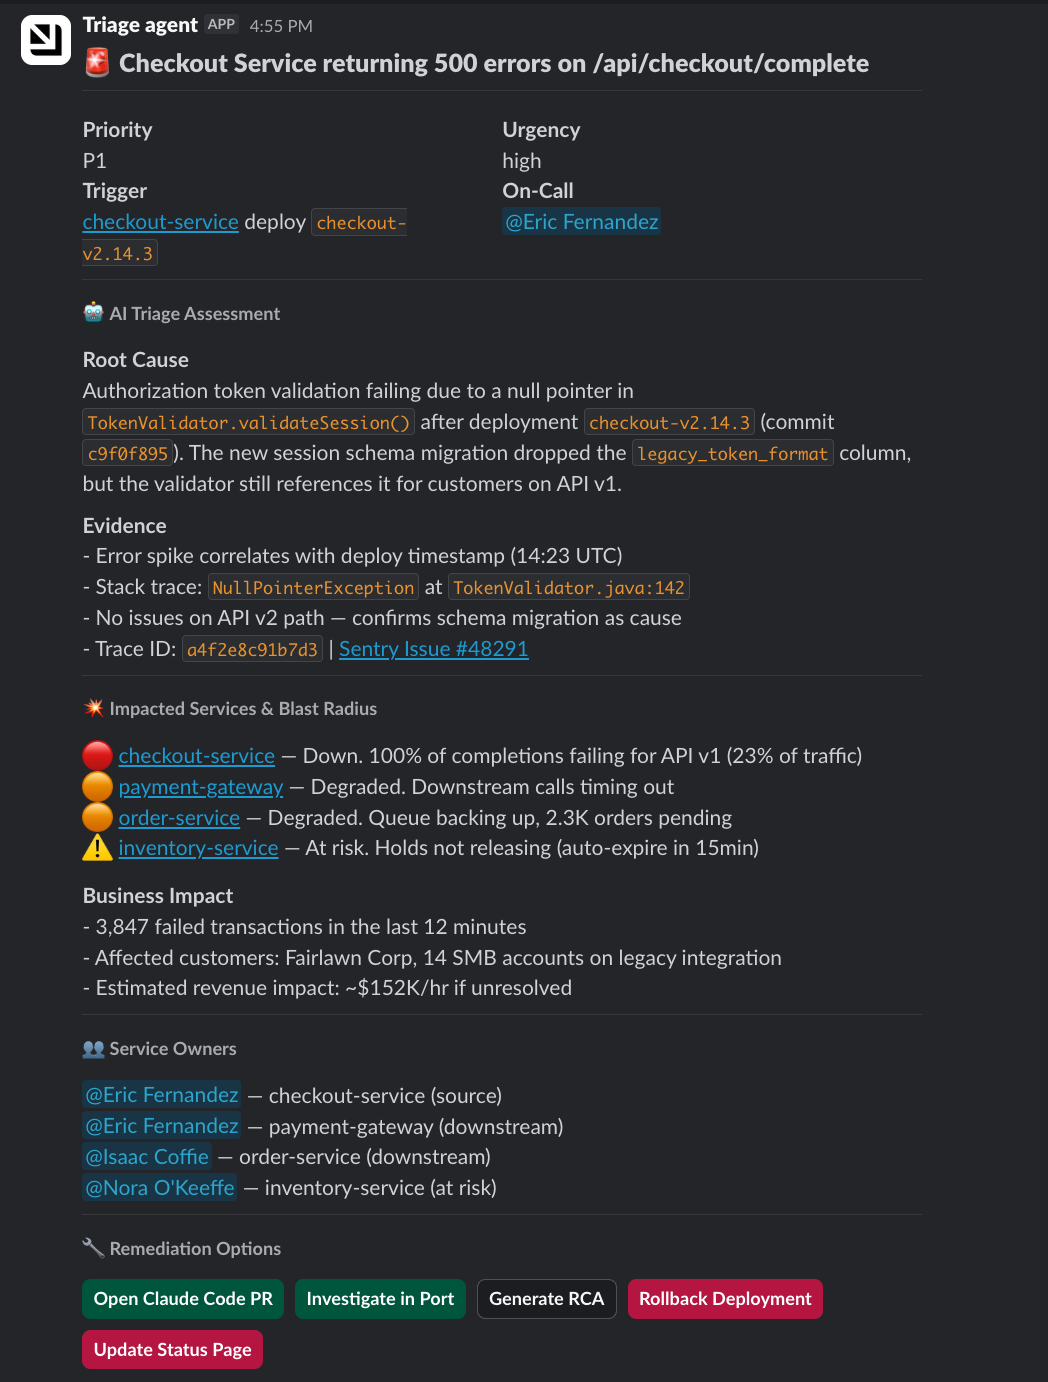
3. Constructs the triage message. The agent formats everything into a Slack message for the on-call engineer: priority, urgency, affected service with a link to its catalog page, recent deployments, dependent services, and suggested next steps.
4. Presents remediation options. The Slack message includes buttons that map to Port self-service actions: open a Claude Code PR, rollback deployment, update status page, or open the investigation room in Port for deeper analysis with MCPs.
The context lake gives the agent the knowledge. The skill tells it what to do with that knowledge. We're publishing the full skill file so you can adapt it for your own setup.
Why Port
The agent does the investigation. But when it's time to act, like restarting a service, scaling out workers, or rolling back a deployment, a human approves it through Port. Here's why that matters.
1. Actions engineers already trust: The agent recommends the action "restart action-service-worker." The engineer doesn't need to know which repo that lives in or which workflow to trigger. They click approve in Slack, and Port routes it to the right action. It's the same action the engineer used manually during the Kafka incident, except now the agent is the one finding the action and the human is just confirming.
2. Guardrails to let agents work: When the agent triggers a scale-out through Port, it's temporary by design. The change has a time-to-live and reverts automatically after the incident. Without it, someone bumps a number in Kubernetes and it stays that way until the next deployment. Agents that can scale things up need infrastructure that scales them back down.
3. Autonomous under control: Every action the agent takes runs through Port, so there's a full record. What the agent recommended, what the human approved, when it executed, on which service, etc. When an agent is making decisions on its own, you need to be able to trace every step the next morning.
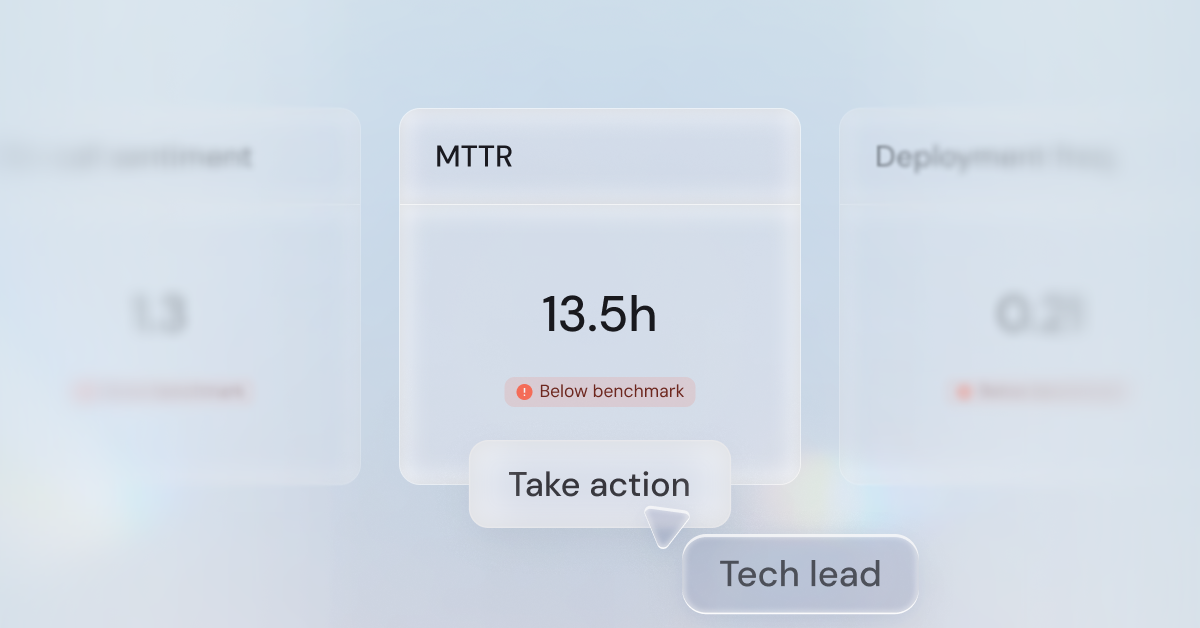
4. Quantify ROI & quality: Port tracks every agent action: what it triaged, what it recommended, what a human approved or overrode, how long it took. That means that over time, you can measure things like:
- how much time the agent saved per incident
- how often engineers accepted the recommendation vs. overrode them
- the sentiment from engineers on how the agent performed
Put these on a dashboard and then you'll know exactly what autonomous incident resolution is worth and where it still needs work.
What's next
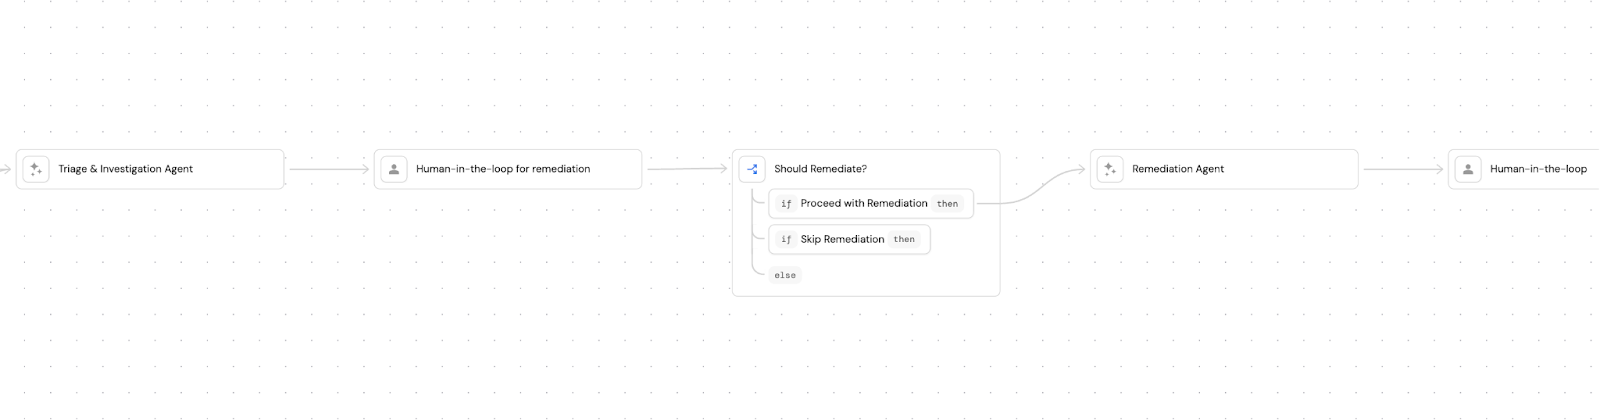
The triage agent is just the first step. We're building Port to heal incidents autonomously. So let's revisit the Kafka incident and see how it would have gone differently.
Step 1: Agent investigates and reports. This is where we are now. The agent posts affected services, blast radius, and tags relevant users on Slack.
Step 2: Agent correlates and triages. Instead of three teams investigating in separate threads, the agent would have checked timestamps and affected resources across all three PD alerts, seen they pointed to the same offset lag, and opened one channel.
Step 3: Agent suggests fixes with human approval. Our engineer tried a restart first. It didn't help. The problem was capacity, not a stuck consumer. An agent with access to the lag rate and consumer group status would have skipped the restart and posted: "Recommended: scale to 15 pods." It would have just presented a button on Slack.
Step 4: Agent executes the fix with guardrails. The scale-out runs through Port's self-service action with TTL, so it reverts automatically. There's a full audit trail.
Step 5: The post-mortem writes itself. After this incident, one of our engineers spent most of a day on the post-mortem, pulling context from his head and Slack, pasting it into ChatGPT with our template, cleaning it up, writing it in Notion. But most of that context already exists in Port. The actions that were run, the alert history, the timeline. Port already knows you're on-call. If every action you run during an incident attaches itself automatically to the incident, the RCA is just a summary of what's already recorded. Port can also pull the Slack conversations with the Slack MCP connector and include those for extra context.
The incident management future we see
Incident management is moving from reactive to autonomous. We already know agents can do it. The question is how you get there without losing control.
The companies moving fastest are building agents that pursue multiple hypotheses in parallel, correlate across systems, and suggest remediations. They're participants in the on-call rotation that work across your code, infra, and telemetry.
We think the foundation for that is context. An agent that doesn't know your architecture, your ownership model, your dependencies, and your playbooks can just be a faster way to get the wrong answer. The context lake and the skill file are what turn a generic agent into one that investigates the way your team does.
If you want to build something similar to what we described, we're publishing the skill file, the workflow definition, and a guide for how we do incident management at Port.


Get your survey template today
Download your survey template today


Free Roadmap planner for Platform Engineering teams
Set Clear Goals for Your Portal
Define Features and Milestones
Stay Aligned and Keep Moving Forward
Create your Roadmap


Free RFP template for Internal Developer Portal
Creating an RFP for an internal developer portal doesn’t have to be complex. Our template gives you a streamlined path to start strong and ensure you’re covering all the key details.
Get the RFP template


Leverage AI to generate optimized JQ commands
test them in real-time, and refine your approach instantly. This powerful tool lets you experiment, troubleshoot, and fine-tune your queries—taking your development workflow to the next level.
Explore now
Check out Port's pre-populated demo and see what it's all about.
No email required
.png)
Check out the 2025 State of Internal Developer Portals report
No email required
Minimize engineering chaos. Port serves as one central platform for all your needs.
Act on every part of your SDLC in Port.
Your team needs the right info at the right time. With Port's software catalog, they'll have it.
Learn more about Port's agentic engineering platform
Read the launch blog
Contact sales for a technical walkthrough of Port
Every team is different. Port lets you design a developer experience that truly fits your org.
As your org grows, so does complexity. Port scales your catalog, orchestration, and workflows seamlessly.
Port × n8n Boost AI Workflows with Context, Guardrails, and Control

Book a demo right now to check out Port's developer portal yourself
Apply to join the Beta for Port's new Backstage plugin


n8n + Port templates you can use today
walkthrough of ready-to-use workflows you can clone
Further reading:

Learn more about Port’s Backstage plugin