AI SRE: Cut MTTR in Half with Autonomous Incident Resolution
See how an SRE agent workflow cuts MTTR in half, using full context to triage, diagnose, and fix incidents autonomously, all the way to a RCA.



.png)
The hard part of an incident was never spotting it. It's everything you do between the alert and the fix.
In a recent live session, Kevin Wolf, one of our product solutions leads, and I built an autonomous incident resolution workflow in Port from scratch to make that case. The headline number, a 50% cut in MTTR, is the gap between handling an incident the way most teams do today, a human paging through dashboards at 2am, and handling it with an agent that starts from full context. The reasoning is plain, most of an incident's runtime goes to reconstructing what your systems already know, not to writing the fix. Cut that part out and the rest follows.
The triage loop is where the time goes
Detection is the part we've already solved. A monitor breaches a threshold, the alert fires, and within seconds you know a service is degraded. The part that actually moves your MTTR starts after that, when an engineer has to assemble everything the alert left out.
The process is predictable, which is the frustrating part. You read the logs, scan the dashboards for the spike, pull the recent traces, find out who owns the service, dig up the runbook if one exists, and decide whether to roll back the last deploy or scale out. For a large share of production incidents the cause is a recent change, but the alert won't tell you that, so you go hunting for it. Often you hit a wall halfway through, because you don't have the right Datadog view, or the permission to open a PR, or a clear owner to escalate to.
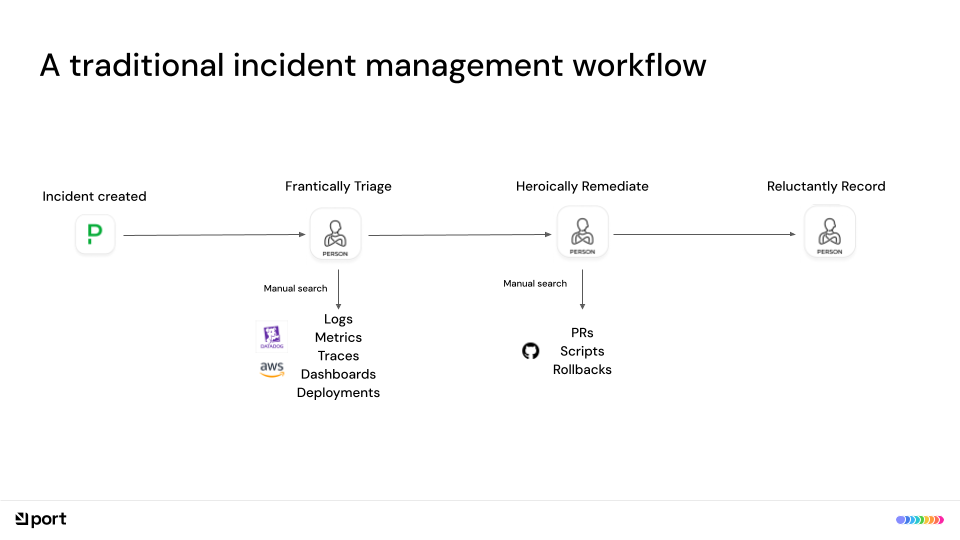
As Kevin put it in the session, drawing on his own years on call, this is the moment the engineer is frantic: not because the fix is hard, but because everything needed to find it is scattered across systems that don't talk to each other. Better monitoring didn't change that. It sharpened the alerts, but the on-call rotation never got lighter, it just got more precise about what to page you for. That stretch an engineer burns rebuilding ownership, recent changes, and the right response might run five minutes or it might run an hour. Either way, it's the slice of MTTR no dashboard has ever solved.
Why "just feed it to an agent" fails
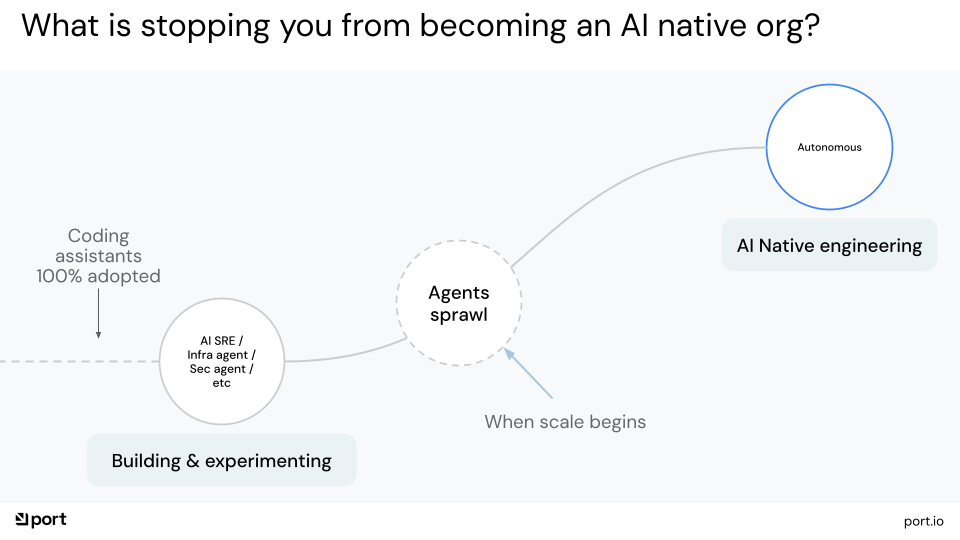
The instinct, increasingly, is to hand the alert to an agent and walk away. Route the alert to Cursor, Codex, or Cognition and let it produce a fix. When researchers at the University of Illinois and the University of Toronto benchmarked frontier SRE agents against 90 high-fidelity production failures, the agents resolved application-layer issues well but stumbled badly elsewhere, with up to 40% swings in end-to-end success depending on the failure type. Two patterns explain most of the gap, and most teams hit both.
The first is the agent latching onto its first hypothesis. It fixes on the first signal it sees, a single log line or one trace, and commits to that path before it has the full picture, which makes it fast and confidently wrong. The benchmark calls it the "greedy" approach, and it shows up whenever an agent stops investigating the moment it finds something that looks like a cause.
The second is distraction. Real incidents don't arrive clean; they come with unrelated, low-impact faults firing at the same time, and the study found those throw agents off in nontrivial ways. Hand an agent the raw firehose and it reasons worse the more it ingests, because the signal is buried in everything else.
A companion line of work from the same Toronto group points at the fix. When the agent works from a structured graph of the environment, its dependencies, traces, and service relationships, instead of raw, unbounded telemetry, root cause accuracy climbs by as much as 42% over the prior best methods. Context is what makes agentic RCA work: the agent reasons from a structured graph, not raw telemetry. It isn't a layer you add on top of the model. It's the thing that decides whether the agent helps you or hurts you.
{{from_manual_to_autonomous_engineering}}
What the agent works from: the context lake
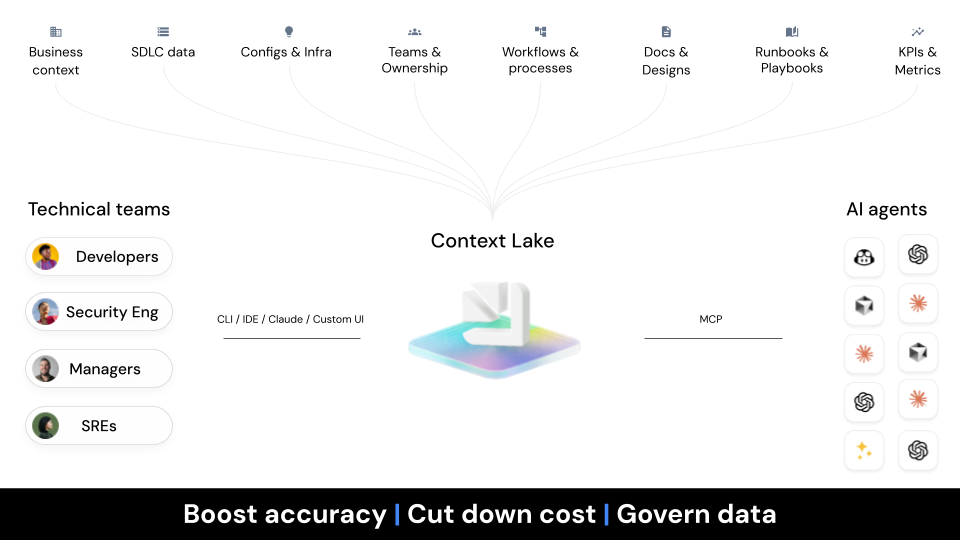
That graph is the context lake, a live model of your environment where an incident connects to the things that explain it. The affected service, the team that owns it, who's on call, the last deploy and its diff, the open vulnerabilities on the repo, the runbook that maps to this monitor class are all one query away.
It changes how the agent investigates. Instead of scanning every dashboard and log source it can reach, the agent queries the graph, learns this is a Tier-1 service owned by Payments, sees the last deploy landed 22 minutes ago, and pulls the one metric and trace tied to that change. The same graph bounds what the agent can touch, so the structure that makes it accurate is the structure that keeps it governed. Relevant data in, noise and risk out.
The loop, start to finish
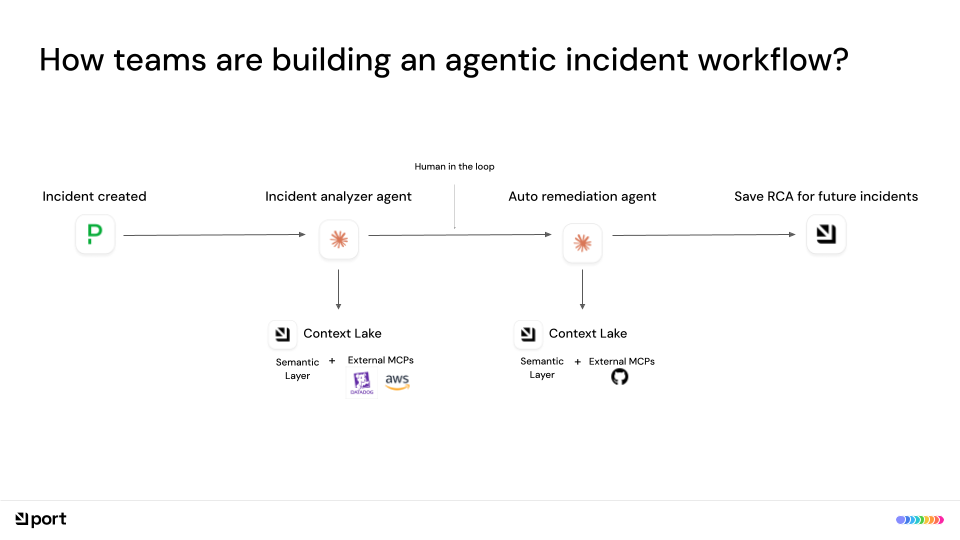
Here's the same incident, rebuilt as a workflow. Every step that used to be a person digging through disconnected systems under pressure is now a step that runs in seconds, with you deciding how much of it to watch and how much to automate. We built it live in the session, so this is the actual run, not a mockup.
PagerDuty fires and the webhook hits Port in seconds. The agent queries the context lake, investigates across Datadog, GitHub, and AWS through their MCP servers, and writes the root cause. Then it posts to the incident war room in Slack: the error rate and the affected endpoint, what AWS returned, the recent GitHub changes, the top Datadog errors. Three actions ride along with it, so you can roll back the recent deploy, dig in manually, or review in Port and approve.
Approve it and a Cursor node opens the PR straight from the remediation notes, then the fix lands back in Slack alongside a written timeline and the start of a post-mortem, business impact and sequence of events already laid out for you to build on. That write-up is the RCA agent's job: it turns the resolved incident into a structured root cause analysis so the report a human usually writes up afterward is already drafted. Every gate in that flow is configurable, so you can keep a human approving each step or let the agent run from detection to merged PR once you trust it on a class of incident.
This is where the MTTR reduction comes from. An agent without context burns the same time a groggy human does, chasing the wrong first signal or drowning in telemetry. An agent that starts from the graph skips straight to the diagnosed problem. You take the triage loop out of every incident, and you take a whole class of incidents out of human hands entirely. The ones that still escalate show up with the picture already assembled, so the engineer makes one call on a diagnosed problem instead of rebuilding the context from scratch.
You don't hand an agent production access on faith
Port logs every run: who triggered it, how long it ran, how many tokens it spent, every AI invocation written to the audit log. That's what lets you catch failed workflows and tighten how your agents behave over time instead of hoping it holds. We also walked through a dashboard that tracks the outcomes, PR cycle time, throughput, and stale PR share, set against AI adoption and cost, at the company, team, or service level.
It tracks with what the room told us. We ran a live poll during the session asking where incident response breaks down, and 48% of attendees pointed at the same thing: when an incident fires, they're missing what they need to act fast.
That missing context is the whole game. Give an agent the graph of your environment and incident resolution stops being a frantic reconstruction job at 2am and becomes a workflow you supervise. The triage loop shrinks, a class of incidents stops reaching a human at all, and the MTTR number follows.
See it in action
Reading the steps is one thing. Watching the agent triage a live incident, write the root cause, and open the PR in real time is what makes it click. We build the whole workflow from an empty canvas in the recording.
Watch the session below:
Try it for yourself
Incident triage is the low-risk, high-value place to start. Connect your services to their deploys and PRs, add a couple of MCP servers, put an agent on top, and keep the human in the loop until you're ready to step back.
Start building for free, up to 15 users, or book a demo if you'd rather walk through it with us.


Get your survey template today
%201.svg)


Download your survey template today


Free Roadmap planner for Platform Engineering teams
Set Clear Goals for Your Portal
Define Features and Milestones
Stay Aligned and Keep Moving Forward
Create your Roadmap


Free RFP template for Internal Developer Portal
Creating an RFP for an internal developer portal doesn’t have to be complex. Our template gives you a streamlined path to start strong and ensure you’re covering all the key details.
Get the RFP template


Leverage AI to generate optimized JQ commands
test them in real-time, and refine your approach instantly. This powerful tool lets you experiment, troubleshoot, and fine-tune your queries—taking your development workflow to the next level.
Explore now
Check out Port's pre-populated demo and see what it's all about.
No email required
LIVE WEBINAR, Aug 18, 2026:
Context-aware Vibe Coding for Platform Engineering
Thursday, October 22 12:00pm EDT⋅6:00pm CET
To learn more about the new capability and to see a live demo, join our upcoming community session with GitHub
Move fast while staying in control
Build governed agentic workflows on one central platform.
See it in action:
Watch this video on generating Terraform with Port, or explore our public demo.
.png)
Check out the 2025 State of Internal Developer Portals report
No email required
Minimize engineering chaos. Port serves as one central platform for all your needs.
Act on every part of your SDLC in Port.
Your team needs the right info at the right time. With Port's software catalog, they'll have it.
Learn more about Port's agentic engineering platform
Read the launch blog
Contact sales for a technical walkthrough of Port
Every team is different. Port lets you design a developer experience that truly fits your org.
As your org grows, so does complexity. Port scales your catalog, orchestration, and workflows seamlessly.
Port × n8n Boost AI Workflows with Context, Guardrails, and Control
Port Builders Session: A Single, Governed Interface for All MCP Servers
Book a demo right now to check out Port's developer portal yourself
Apply to join the Beta for Port's new Backstage plugin


n8n + Port templates you can use today
walkthrough of ready-to-use workflows you can clone
From manual to autonomous engineering
One platform to build, govern, and operate the Agentic SDLC.
Port is open for you to try it
build your first agentic workflow today