Which engineering metrics actually drive outcomes?
Metrics without context don’t really drive improvement. And can really do more harm than good.

Engineering leaders are under pressure to demonstrate visibility, predictability, and ROI. DORA metrics have become the default answer. But applying a single set of metrics - one size fits all - across all teams in large, heterogeneous organizations often raises more questions than it answers. In a recent live session, we walked through the challenges of how to effectively track the metrics that actually make a difference - for each individual team, and for the broader org. The conversation kept coming back to one theme: metrics without context don’t really drive improvement. And can really do more harm than good.
DORA works until it doesn’t
DORA is five key metrics that quantify software delivery performance and operational stability. The DORA golden metrics are: deployment frequency, lead time, MTTR, change failure rate, rework rate. Five metrics. One standard applied across your entire engineering organization.
The problem: not every team should be measured the same way.
An infrastructure team maintaining a stable cloud foundation for dozens of application teams will have low deployment frequency by design. A microservices team shipping features daily will have high deployment frequency by necessity. Apply the same benchmark to both, and one looks like a high performer while the other gets flagged as underperforming.
Neither conclusion is accurate. The metrics are doing exactly what they’re supposed to do. The framework just doesn’t account for why.
Team-specific measurement starts with context
A spike in lead time tells you something slowed down. It doesn’t tell you which services are affected, which teams own them, or what changed. That gap between what and why is where most engineering leaders spend their time: pulling data from five systems, chasing owners in Slack, piecing together a picture manually.
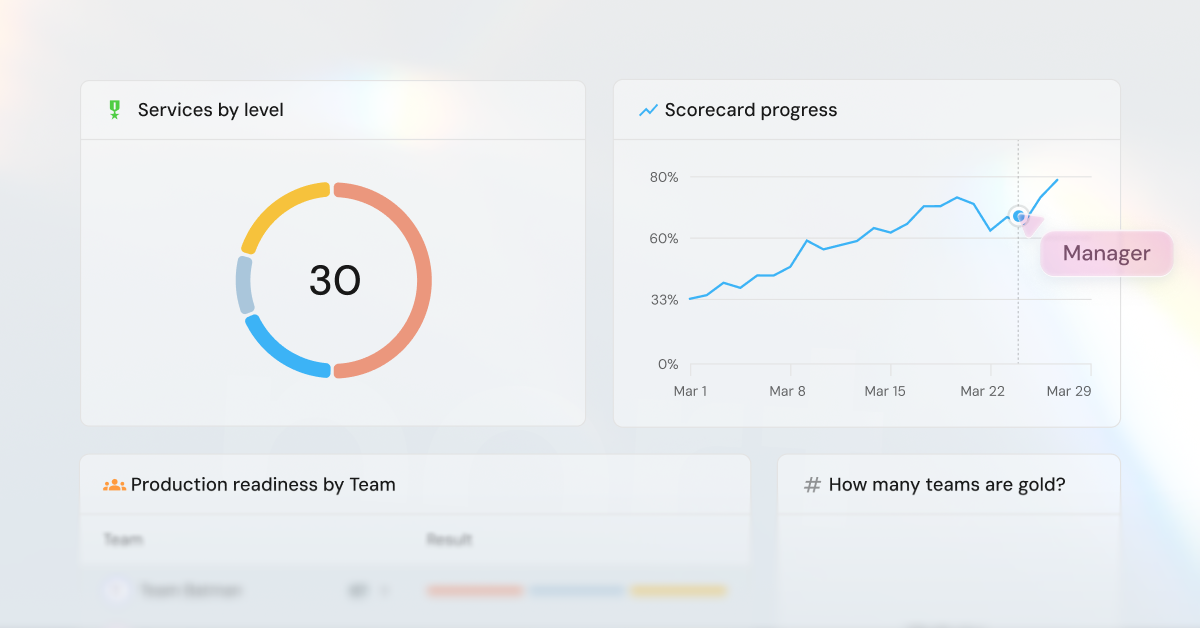
Metrics connected to services, teams, dependencies, and incidents answer the question before you have to ask it. When delivery slows, you see where and why. Leadership can ask about backend services or critical paths and get answers grounded in actual architecture, ownership, and history.
And because every team operates differently, the measurement formula should be different too. An infrastructure team’s deployment frequency benchmark shouldn’t match a feature team’s. Context lets you define what good looks like for each team and service, then measure against that standard.
Standalone dashboards show you the problem. Engineering Intelligence built into the platform tells you where to look, who to talk to, and gives you the workflows to act.
Measurement is not improvement
Most Engineering Intelligence tools stop at the data or the dashboard chart. They surface bottlenecks, standards violations, and delivery slowdowns. Then someone has to manually notify the owner, create a ticket, investigate the cause, figure out a fix, implement, follow up. There’s no system to close the loop.
Without a path from insight to action, the same issues show up month after month.
And leadership has a different problem: they need one view across the entire org. Not fifty dashboards for fifty teams. One place that shows what matters, with the ability to drill down when something is off.
Closing that gap from insight to action (and from too much information to too little) means connecting measurement to the same platform that powers your SDLC itself: your catalog, scorecards, and workflows. When a benchmark slips, workflows notify owners, create tickets, or block risky changes automatically. The loop closes inside the platform.
Try it for yourself
If you want to explore Port for yourself, create an environment and start ingesting data. We have guides for building out DORA use cases, visualizing Jira backlogs, and connecting to your toolchain. Or get creative and build something to solve a problem unique to your org.
If you’d like help getting started, we’re here to help! Sign up for a demo and we’ll walk you through Engineering Intelligence that gives your metrics context.
More resources


Get your survey template today
Download your survey template today


Free Roadmap planner for Platform Engineering teams
Set Clear Goals for Your Portal
Define Features and Milestones
Stay Aligned and Keep Moving Forward
Create your Roadmap


Free RFP template for Internal Developer Portal
Creating an RFP for an internal developer portal doesn’t have to be complex. Our template gives you a streamlined path to start strong and ensure you’re covering all the key details.
Get the RFP template


Leverage AI to generate optimized JQ commands
test them in real-time, and refine your approach instantly. This powerful tool lets you experiment, troubleshoot, and fine-tune your queries—taking your development workflow to the next level.
Explore now
Check out Port's pre-populated demo and see what it's all about.
No email required
.png)
Check out the 2025 State of Internal Developer Portals report
No email required
Minimize engineering chaos. Port serves as one central platform for all your needs.
Act on every part of your SDLC in Port.
Your team needs the right info at the right time. With Port's software catalog, they'll have it.
Learn more about Port's agentic engineering platform
Read the launch blog
Contact sales for a technical walkthrough of Port
Every team is different. Port lets you design a developer experience that truly fits your org.
As your org grows, so does complexity. Port scales your catalog, orchestration, and workflows seamlessly.
Port × n8n Boost AI Workflows with Context, Guardrails, and Control
Port Builders Session: A Single, Governed Interface for All MCP Servers
Book a demo right now to check out Port's developer portal yourself
Apply to join the Beta for Port's new Backstage plugin


n8n + Port templates you can use today
walkthrough of ready-to-use workflows you can clone