Use Port to automate observability maintenance and standards
Learn how to use Port self-service actions, blueprints and scorecards to automate observability checks and transparency.


Observability is a critical part of platform engineering. You have to understand the full context of your software system’s state changes over time to know how and where to improve operations, mitigate drift, and maintain consistent standards.
But as your systems and environments become bigger and more complex, it gets harder to maintain observability and transparency. You have to gather and assess data from fragmented tooling, and that assumes your developers remembered to include the proper hooks at setup.
Port brings structure, automation, and context to observability workflows. In this blog post, you’ll learn how to seamlessly integrate your observability tools — like Grafana, New Relic, and Dynatrace — into your platform engineering workflows using Port.
We’ll cover three use cases that show how everyone in your engineering org can use Port to automate observability setup, enforce standards, detect drift, and deliver better system insights with less toil.
Use case 1: Self-service observability bootstrapping
Let’s face it: We’ve all forgotten to include observability hooks when spinning up a new service. It happens, especially when you leave it until the end.
Port’s internal developer portal helps with this by baking preconfigured observability agents right into the scaffolding process via self-service actions. You can configure observability hooks for any tool of your choice, such as the New Relic APM/Infrastructure Agent, Datadog Agent or the Dynatrace OneAgent, and standardize your configurations. You never have to experience the rude awakening of realizing you have no observability data for a new service!
To create the self-service action, you’ll need to prepare infrastructure templates, integrate your observability tools into those templates (through auto-injection of environment variables, SDKs, or init containers for the observability agents), and configure Port to expose them as self-service actions.
Here’s a quick guide in five steps:
- Prepare your infrastructure templates: Define which observability agent(s) you want to collect each type of data (metrics, logs, traces), include any language or runtime specifications, and define where secrets (API keys, license keys) will come from.
- Write your IaC template: Create an IaC template that includes application resources (service, compute, networking), observability agent installation, and environment configuration.
- Create a self-service action: Wrap your IaC template and set up the Port self-service action backend (using Port’s UI or Automation API) to:
- Parse the input (service name, observability provider)
- Call the appropriate IaC template
- Inject secrets
- Deploy via CI/CD or your orchestration tool
- Take security precautions: Ensure sensitive values (agent license or API keys) are managed securely via CI/CD secrets management, environment injection, Kubernetes secrets, or encrypted SSM parameters for runtime access.
- Register your new service and expose it to developers: After you deploy, use Port’s API to register the new service and link its observability status to your portal by updating the service blueprint with observability metadata.
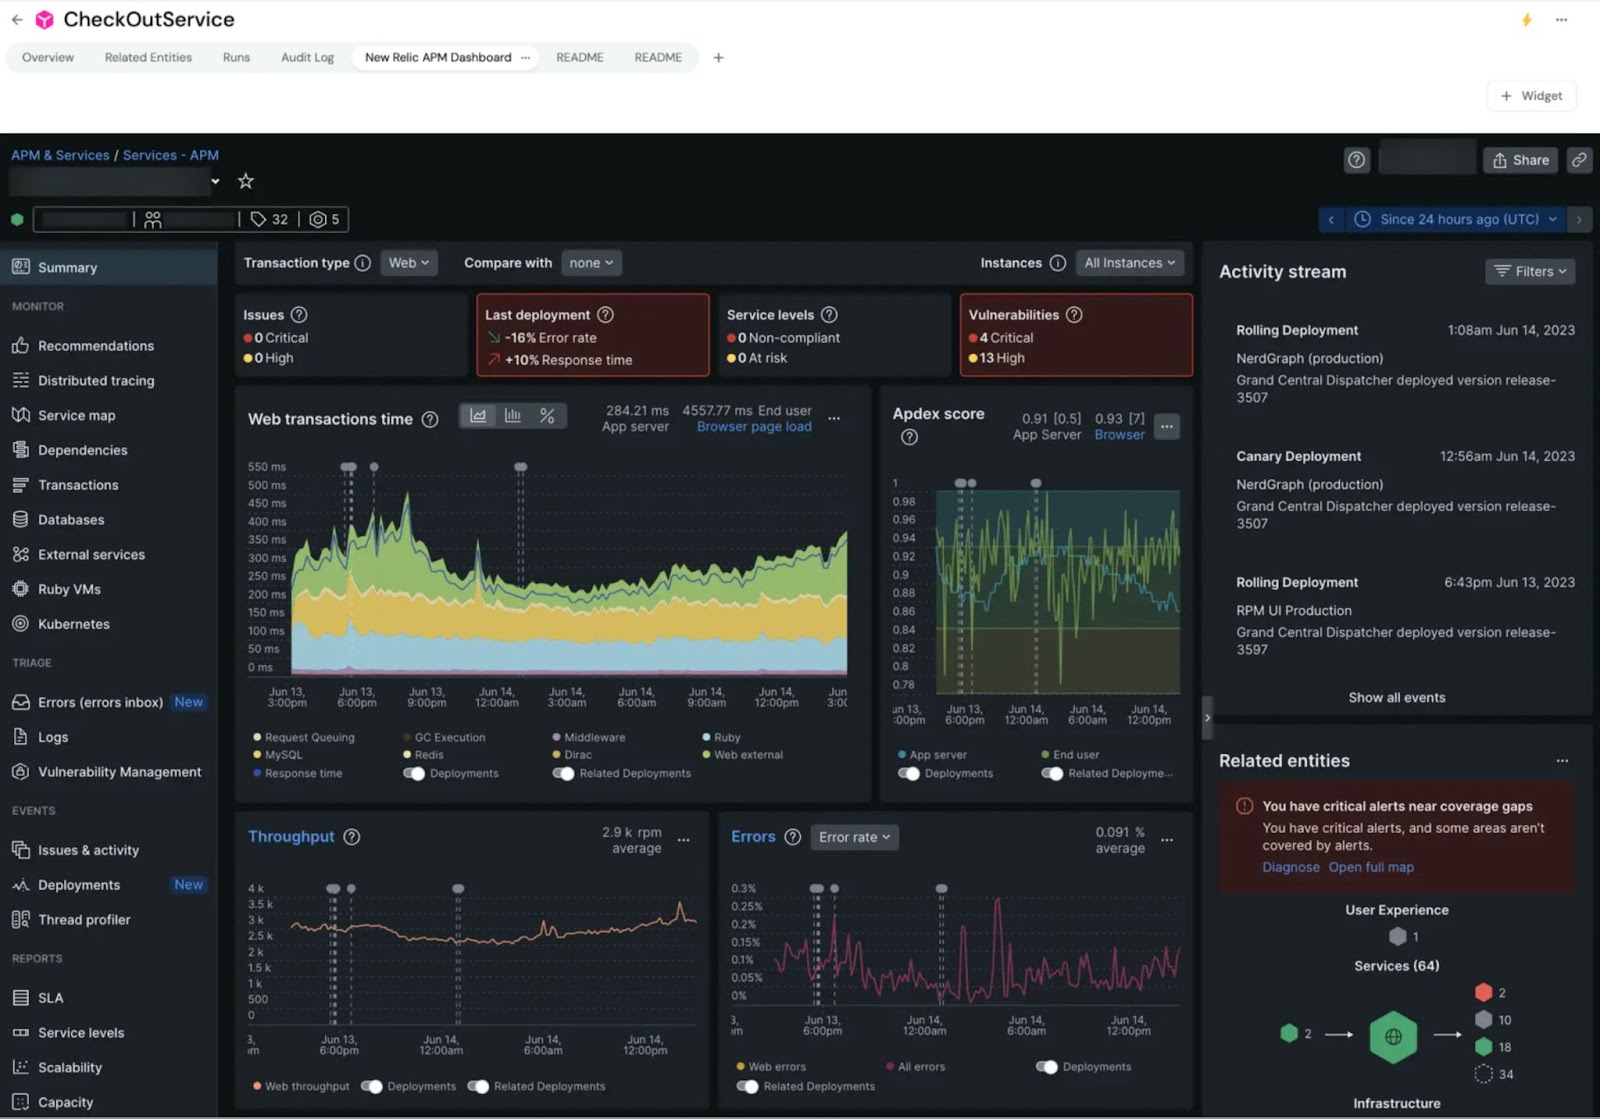
As an example, you can create a self-service action in Port that scaffolds a new service with the option of pre-configuring New Relic instrumentation — just embed your instrumentation setup into your IaC template.
After those steps are complete, you can further enhance the workflow by creating a default APM dashboard via New Relic's API after deployment, registering the service in Port, and linking to the dashboard.
Use case 2: Automated service dashboards
Observability tools like Dynatrace and Grafana provide powerful out-of-the-box dashboards. But it’s unusual for many developers in an organization to have access to those tools, and you’re unlikely to find anyone eager to navigate yet another analytics interface.
But these tools are valuable for a reason: the wealth of important observability data they collect is essential for fixing bugs and troubleshooting other issues. Communicating only what is needed and leaving out the rest can be a difficult task.
Port provides a helpful abstraction layer here: you can grant all developers a window into Grafana or Dynatrace via integration. Dashboards let you showcase observability insights, while keeping more involved access restricted only to those with native login credentials.
Platform engineering best practices encourage using your portal as the first place developers should go to understand and interact with their many tools, including those for observability. This makes it easier to integrate insights from multiple data sources.
Rather than expecting your devs to manually duplicate their Dynatrace or Grafana dashboards in Port, or switch between tools to view them, you can automate dashboard creation and link to those tools from Port. It’s observability that meets developers where they already are.
Here’s how to do it:
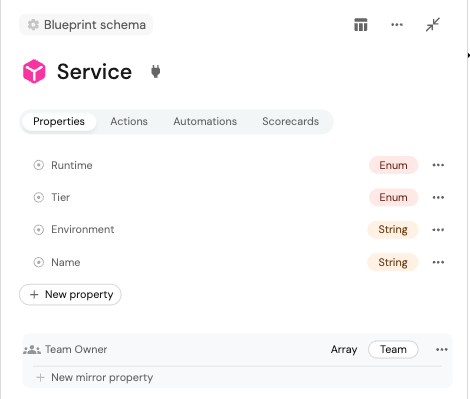
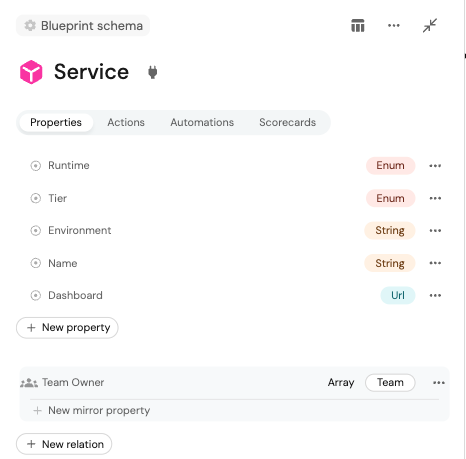
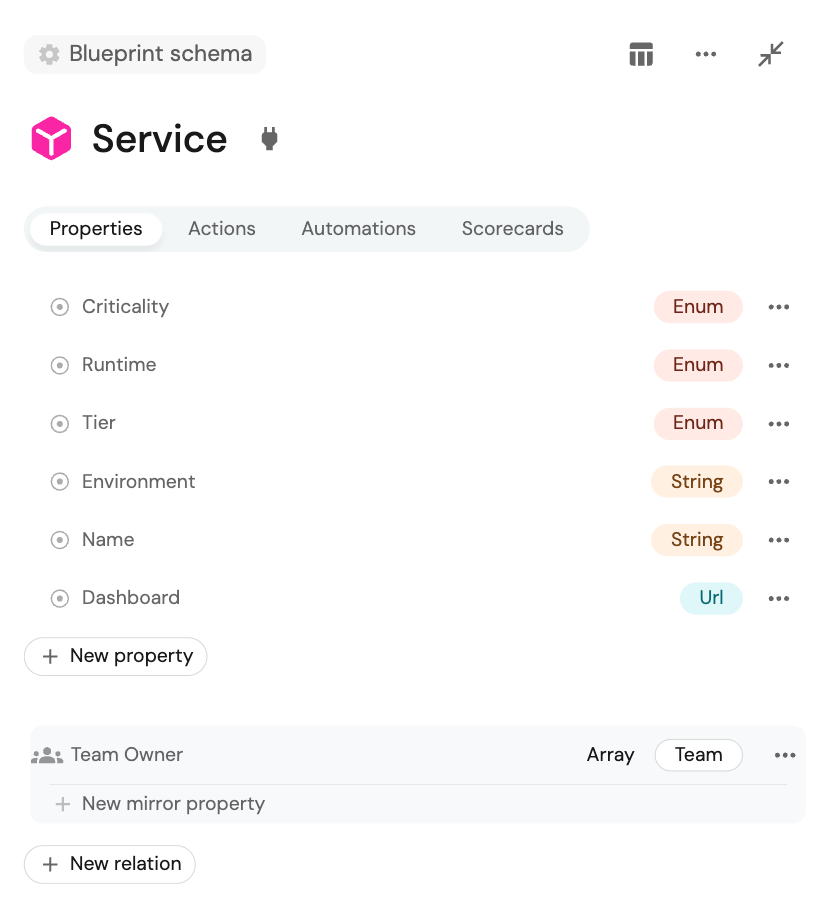
- Step 1: Define your required service metadata in Port by adding them as fields to your service blueprint to support dashboard creation. Examples of metadata can include service name, environment, team owner, runtime or stack, and tier. This ensures you have the necessary inputs to customize dashboards.
- Step 2: Depending on the observability tool you’re using, you should prepare a baseline dashboard template that supports variables or parameters; this process will vary depending on your observability tool.
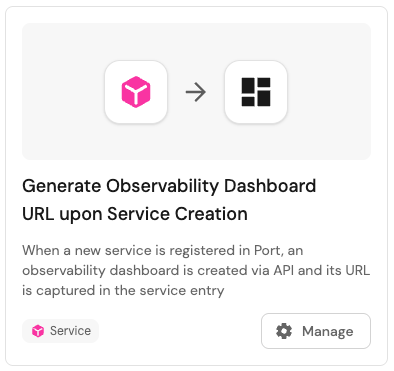
- Step 3: Create a Port automation trigger that fetches a new service’s metadata when it’s registered in Port, then calls the observability platform’s API to create a dashboard (injecting relevant metadata), and captures the generated dashboard URL.
- Step 4: Update the service blueprint in Port with the dashboard URL as part of the entity’s properties:
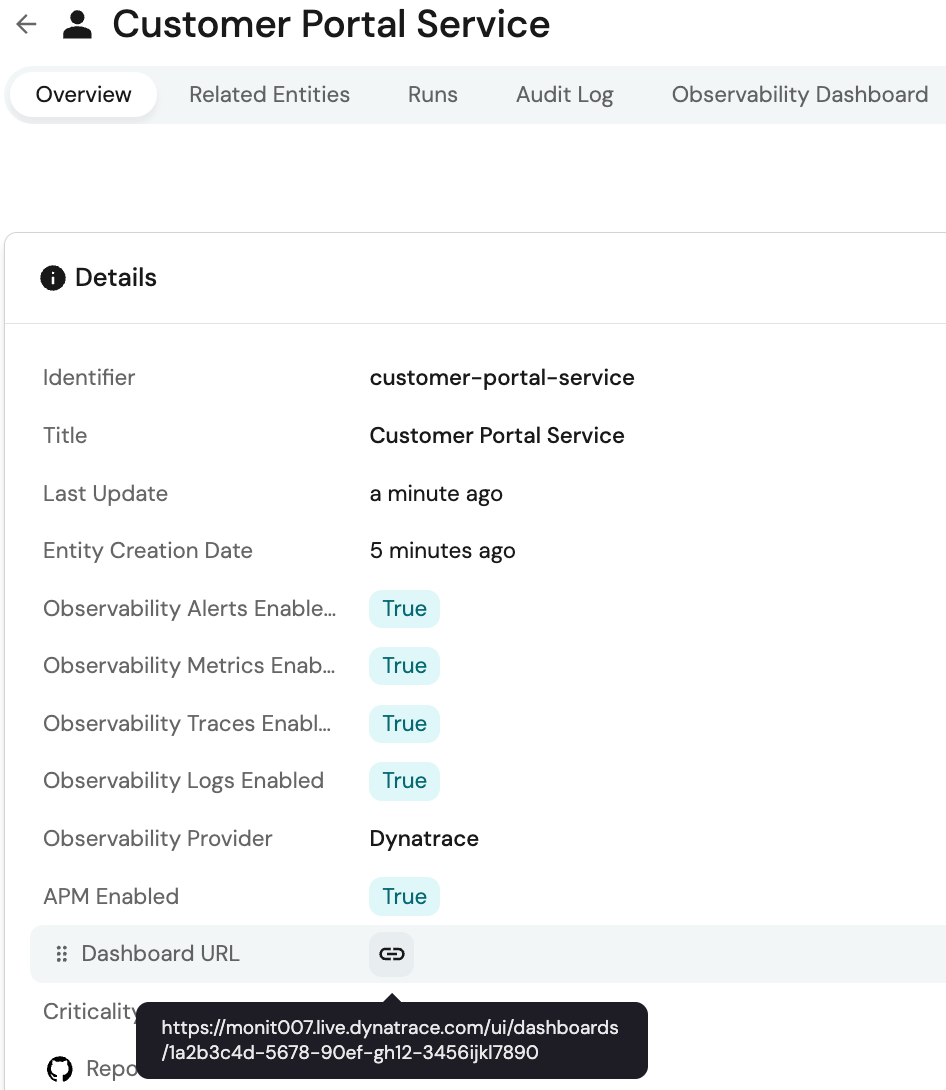
- Step 5: With the dashboard URL now stored in Port as part of the service’s metadata, you can add a link field or custom component in Port’s UI configuration to see the dashboard directly in Port — or, just click through to the observability tool without switching context between tools:
As an example, when a developer registers a new service in Port, an automation calls the Dynatrace API to generate a dashboard and link it in the Port UI. The automation will fetch key metadata from the service entity that is used to dynamically create a dashboard in Dynatrace via its API.
Then, it will authenticate with Dynatrace and send a request to clone a template dashboard, replacing variables like {{service.name}} and {{env}} with the actual values from Port. Once the dashboard is created, the Dynatrace API returns a unique dashboard URL, which will be visible in the service entity.
{{cta_8}}
Use case 3: Monitoring and automating coverage reporting
Team leads need to ensure that all of their services are integrated with observability tools, ideally on creation. This helps with troubleshooting, but also with addressing quality standards and response times.
Engineering managers, on the other hand, are responsible for maintaining observability standards across their designated teams and services, and have a vested interest in finding ways to automate and standardize this practice to ensure compliance.
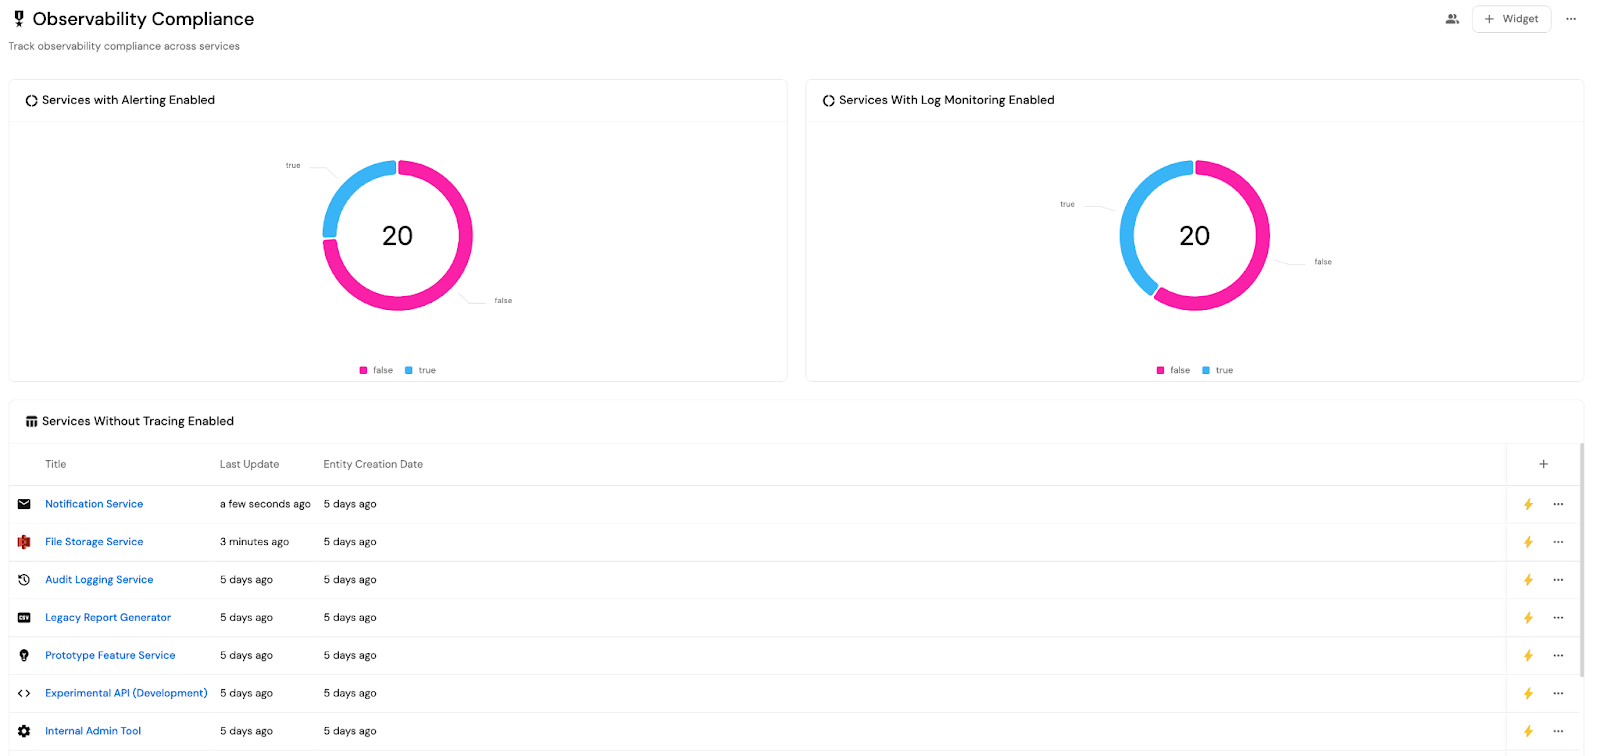
Port’s software catalog solves both issues. The catalog can be used to model observability coverage and present answers to questions like, “does the service have alerts, metrics, traces, logs enabled in an observability tool?”
Team leads and engineering managers can both use the catalog to visualize gaps in observability adoption across teams through dashboards or scorecards showing coverage vs. expectations.
Let’s run through the steps to build a blueprint:
- Check your integration status: Extend your service blueprint to include the fields that represent observability integration status. These fields will track whether each observability component is present for a service.
- Sync your integrations: Set up scripts to sync actual observability state into Port by querying your observability platform’s APIs. For example, in Dynatrace, you can query the availability of services, metrics, and alerting rules and then populate Port entities with that information.
- Step 3: Create a custom view grouped by team or environment.
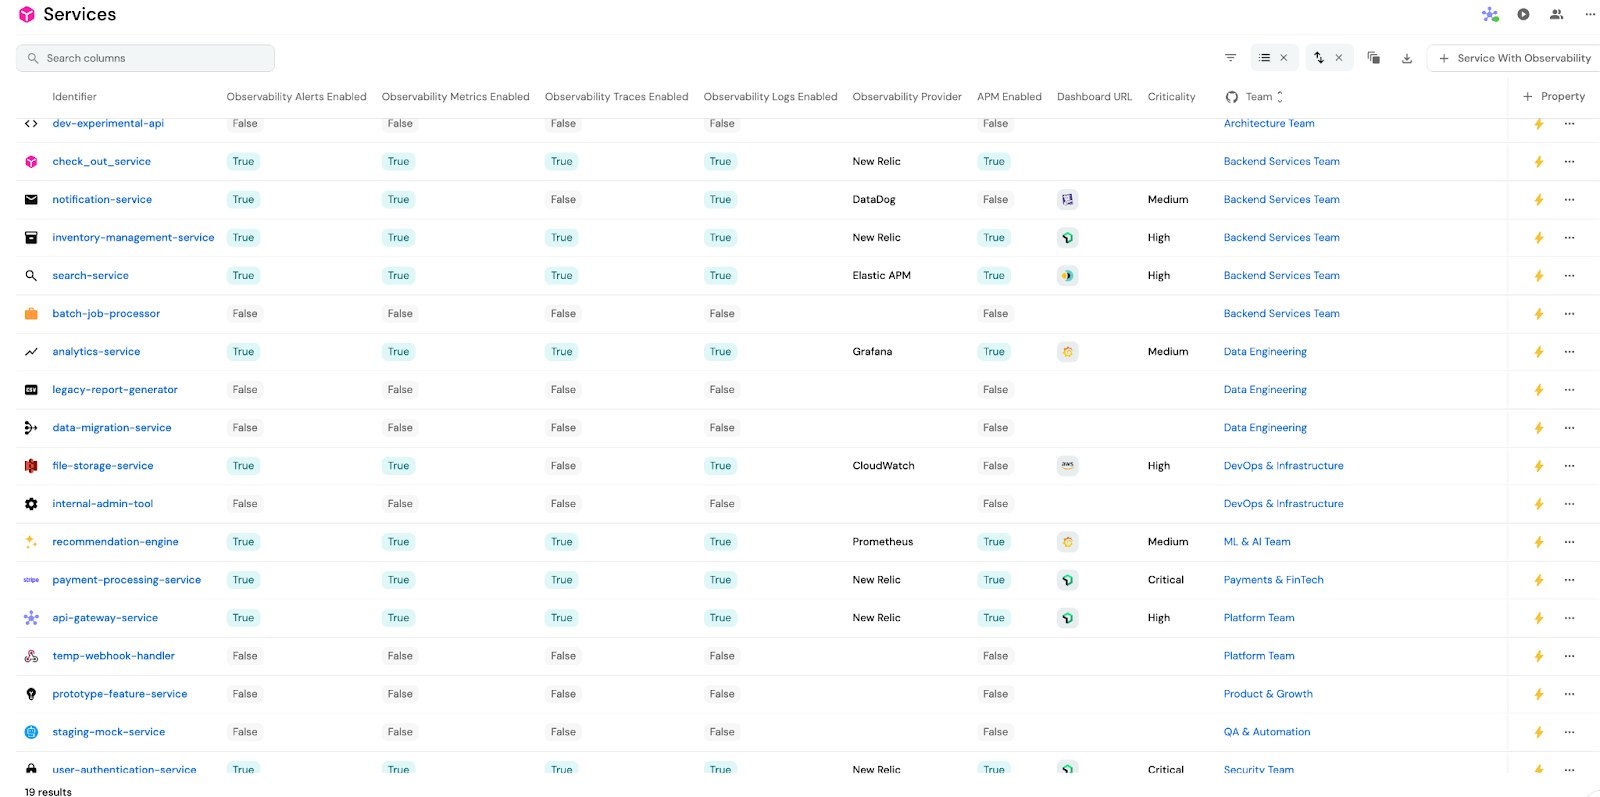
Then, apply filters to highlight services missing observability coverage.
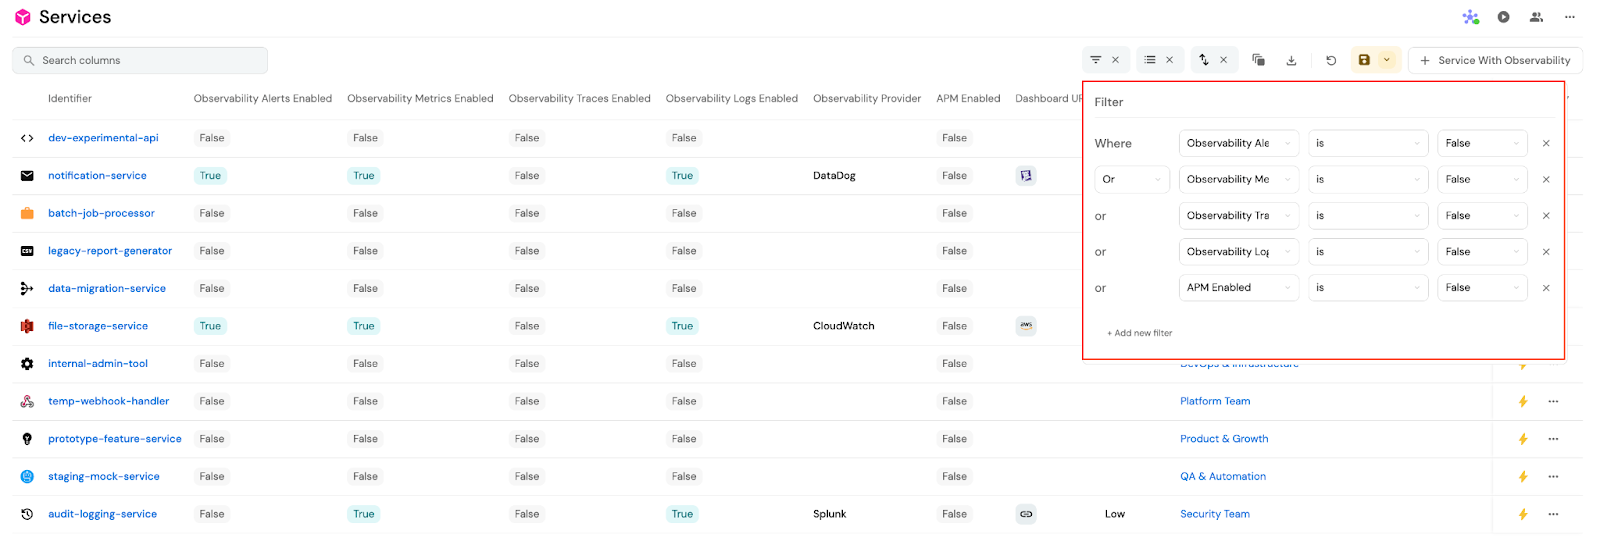
- Step 4: Use Port scorecards, custom badges, or validations to flag gaps in observability. For example, if a service is in production, and the observability flag is false, show a warning flag. Or, block promotion of a service into production if observability is incomplete via Port automations
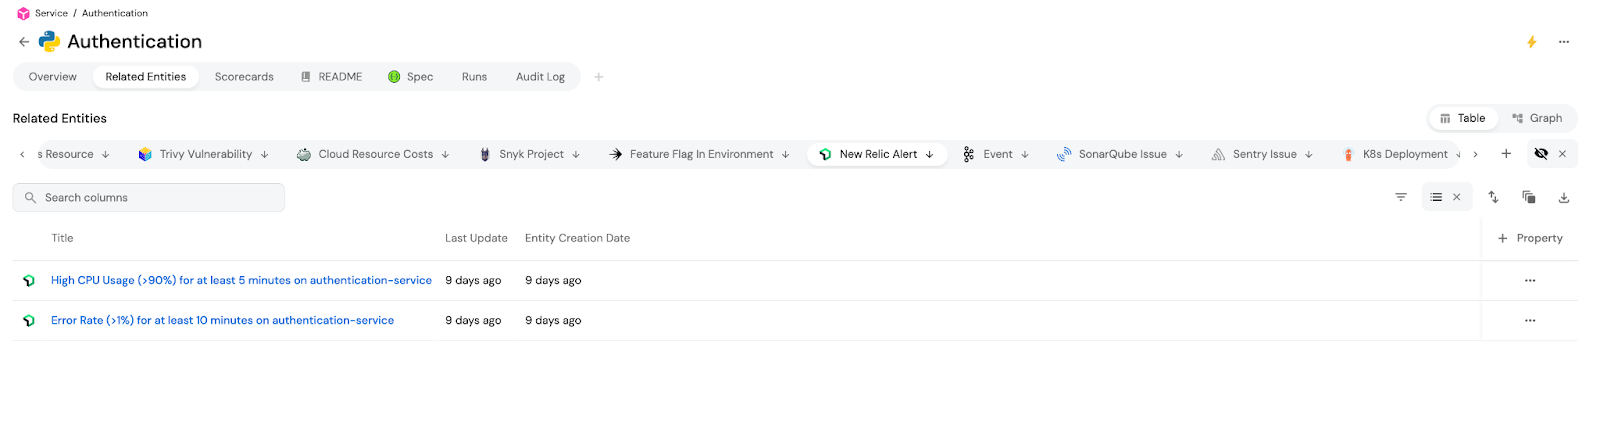
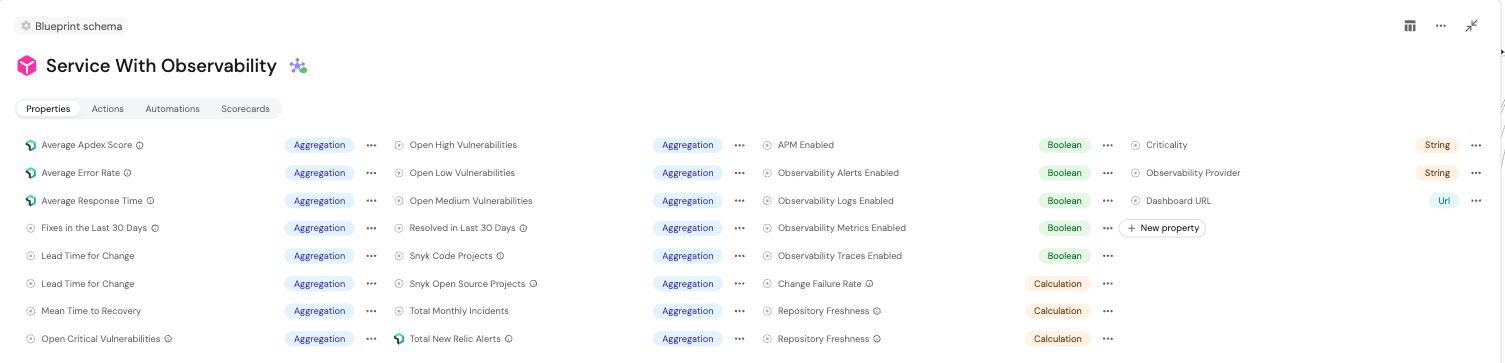
For example, you can create a real-time dashboard in Port that highlights which services are not up to standards because they are missing metrics, traces, or alerts from New Relic. First, extend your service blueprint in Port to include Boolean flags for instrumentation status broken down by key observability components. Then, set up an automation or integration that:
- Queries the New Relic GraphQL or REST API to check for:
- APM agent presence
- Existing alert policies
- Recent metric or trace activity
- Maps each data point to a corresponding service entity in Port
- Updates the observability fields using the Port API
Then, use Port’s entity view filtering to create a custom dashboard and further enhance it. This can look like adding remediation actions, drill-down links to service metadata, owners, or documentation; or adding Slack or email notifications to alert team leads to non-instrumented services.
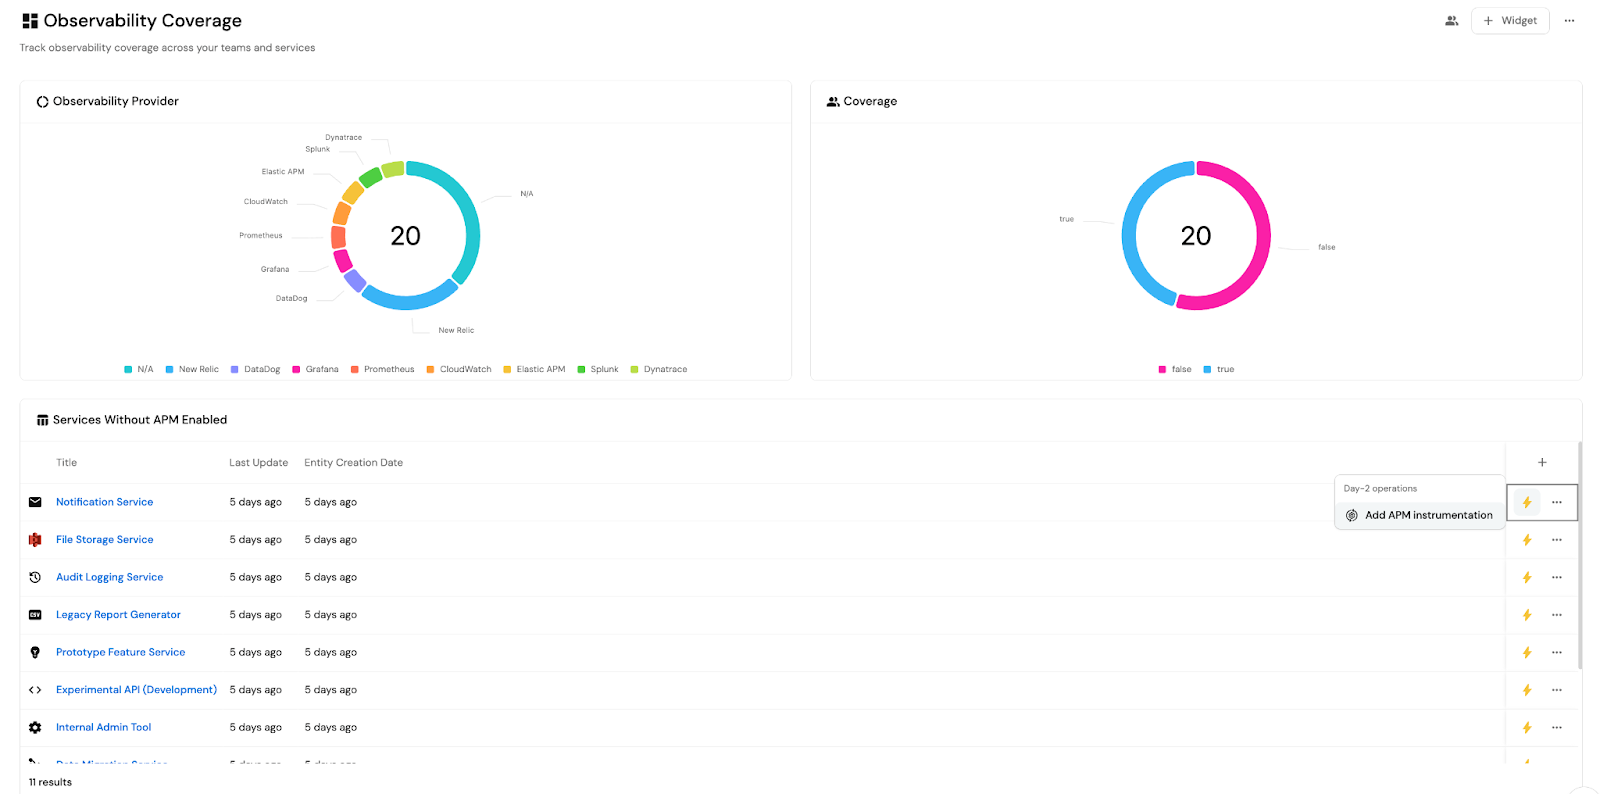
This gives you a live visualization of observability coverage across your stack, along with the ability to quickly identify and address gaps, reduce reliance on ad hoc audits or manual reports, and proactively enforce observability as part of your platform standards.
Downstream benefits for DevOps
You might be wondering where DevOps engineers come into this process. Since DevOps teams are responsible for creating and maintaining reusable infrastructure templates, like Terraform modules and Helm charts, fewer tickets and resource allocation requests means more time for higher-order projects.
There’s still a lot for DevOps to do in a world without tickets, including working with their platform engineers to ensure that self-service action templates include default observability instrumentation and are used properly at scale. Without needing to respond to ticket requests for commonly needed services, DevOps can focus on core responsibilities like pipeline management and orchestration to improve and scale software delivery.
They can also improve and build upon existing observability standards, while platform teams focus on auditing developers’ compliance by ensuring that all critical services have alerting and logging.
Port makes it easier to do this by aggregating data from multiple observability platforms and correlating it with service criticality. In turn, this makes it easier to generate compliance dashboards or reports showing coverage vs. expectations.
Let’s look at how to create this kind of dashboard:
- Step 1: Add a criticality field to the service blueprint in Port to indicate the importance level of each service. This will allow for the differentiation of compliance expectations based on service importance.
- Step 2: Create an automation to sync observability data into Port to accomplish the following:
- Calls observability platform APIs
- Checks if alerts, logs, or dashboards exist for each service
- Updates each Port service entity with the relevant observability status fields
- Step 3: Build compliance dashboards in Port to visualize all critical services grouped by whether observability alerts and logs are enabled.
- Optional Step 4: As additional enhancements, Slack or email alerts can be triggered when non-compliant services are detected or Port scorecards can be defined to track percentage compliance over time.
As an example, you can generate a weekly report from Port that shows which Tier-1 services are missing log-based alerts in Datadog. Start by updating your service blueprint in Port to classify services and track observability requirements like log alerting. Then, set up an automation that uses the Datadog API to query active log-based monitors and cross-reference them with the service names/IDs registered in Port, and then flag any Tier-1 services without log alert coverage.
After the corresponding Port entity’s log and alert coverage fields are updated accordingly, Port’s dashboards can be used to build a filtered report.
What this means for DevOps
You now have a live, queryable list of all critical services out of compliance which can be delivered as a weekly report in a format of your choosing. With a set up like this, DevOps and compliance teams gain real-time visibility into observability coverage.
Port also becomes a source of truth for both service criticality and instrumentation status, and makes compliance reporting automated, accurate, and audit-ready.
Make Port part of your observability stack
It can be a challenge to enforce standards that enable observability as a best practice, especially because it requires an “extra step” at the end of a task that developers may easily forget. But with Port, DevOps and platform engineers can bake observability into any stage of development — without adding to the lead time, complexity, or cognitive load of their developers.
We’ve discussed just three of the potential use cases Port can offer here, but this is just the beginning. The benefits Port can provide your DevOps team don’t stop with observability. Rather, Port itself is designed to be your central control plane for your entire SDLC, offering teams across your engineering organization fine-grained access to everything they need, without risking or compromising security standards of your complex cloud and development environments.
{{cta_1}}


Get your survey template today
Download your survey template today


Free Roadmap planner for Platform Engineering teams
Set Clear Goals for Your Portal
Define Features and Milestones
Stay Aligned and Keep Moving Forward
Create your Roadmap


Free RFP template for Internal Developer Portal
Creating an RFP for an internal developer portal doesn’t have to be complex. Our template gives you a streamlined path to start strong and ensure you’re covering all the key details.
Get the RFP template


Leverage AI to generate optimized JQ commands
test them in real-time, and refine your approach instantly. This powerful tool lets you experiment, troubleshoot, and fine-tune your queries—taking your development workflow to the next level.
Explore now
Check out Port's pre-populated demo and see what it's all about.
No email required
.png)
Check out the 2025 State of Internal Developer Portals report
No email required
Minimize engineering chaos. Port serves as one central platform for all your needs.
Act on every part of your SDLC in Port.
Your team needs the right info at the right time. With Port's software catalog, they'll have it.
Learn more about Port's agentic engineering platform
Read the launch blog
Contact sales for a technical walkthrough of Port
Every team is different. Port lets you design a developer experience that truly fits your org.
As your org grows, so does complexity. Port scales your catalog, orchestration, and workflows seamlessly.
Port × n8n Boost AI Workflows with Context, Guardrails, and Control
Port Builders Session: A Single, Governed Interface for All MCP Servers
Book a demo right now to check out Port's developer portal yourself
Apply to join the Beta for Port's new Backstage plugin


n8n + Port templates you can use today
walkthrough of ready-to-use workflows you can clone